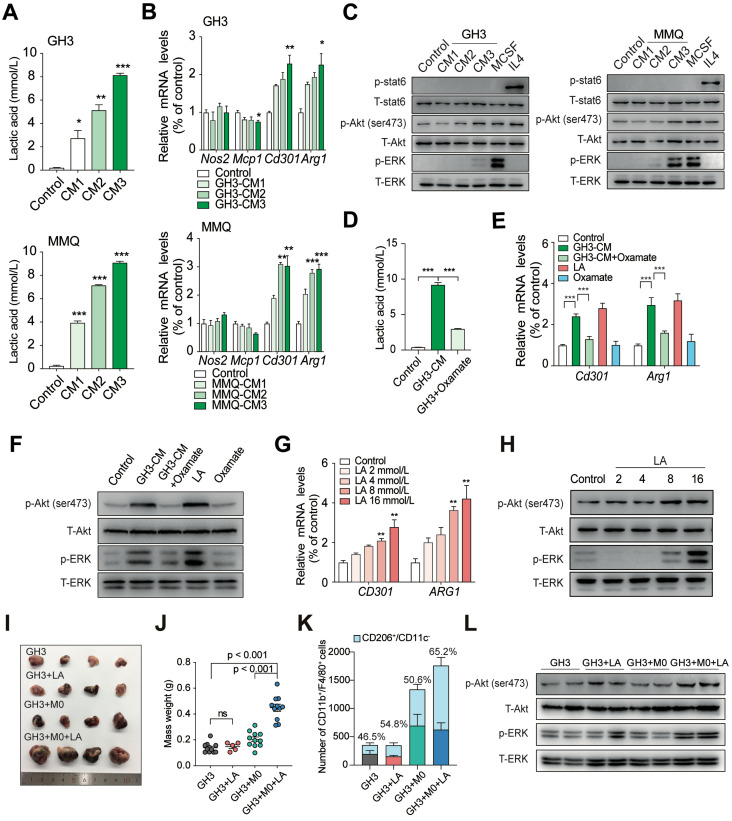
Figure 3.
Lactic acid induces the M2-like polarization of macrophages in PA. A, Concentration of lactic acid in CM from GH3 or MMQ cells. B, Quantification of Nos2, Mcp1, Cd301 and Arg1 mRNA expression in BMDMs stimulated with CM from GH3 and MMQ cells for 24 h. C, Western blot analysis of STAT6, Akt (ser473), and ERK in BMDMs treated with GH3 or MMQ cell-derived CM, M-CSF (10 ng/ml), or IL4 (10 ng/ml) for 15 min. D, Concentration of lactic acid in CM from oxamate-treated or untreated PA cells. E, Quantification of Cd301 and Arg1 mRNA expression in BMDMs stimulated with lactic acid/oxamate alone, or CM from oxamate-treated PA cells or CM from PA cells for 24 h. F, Western blot analysis of Akt (ser473) and ERK in BMDMs stimulated with GH3 or MMQ cell-derived CM or CM from oxamate-treated GH3 and MMQ cells for 15 min. G, Quantification of CD301 and ARG1 mRNA expression in THP1 cells treated with lactic acid at indicated concentration for 24 h. H, Western blot analysis of Akt (ser473) and ERK in THP1 cells treated with lactic acid at indicated concentration for 15 min. I, Representative images showing tumors harvested from mice bearing tumors in the GH3, GH3+LA, GH3+M0, and GH3+M0+LA group. J, Weight of mice bearing tumors in the GH3, GH3+LA, GH3+M0, and GH3+M0+LA groups. K, Stacking bar chart of the number of infiltrated CD11b+/F4/80+ and CD11b+/F4/80+/CD206+/CD11c- cells in harvested tumors from the GH3, GH3+LA, GH3+M0, and GH3+M0+LA groups. L, Western blot analysis of Akt (ser473), and ERK in tumor tissues from mice in the GH3, GH3+M0, and GH3+M0+LA groups. *P < 0.05, **P < 0.01, and ***P < 0.001.

