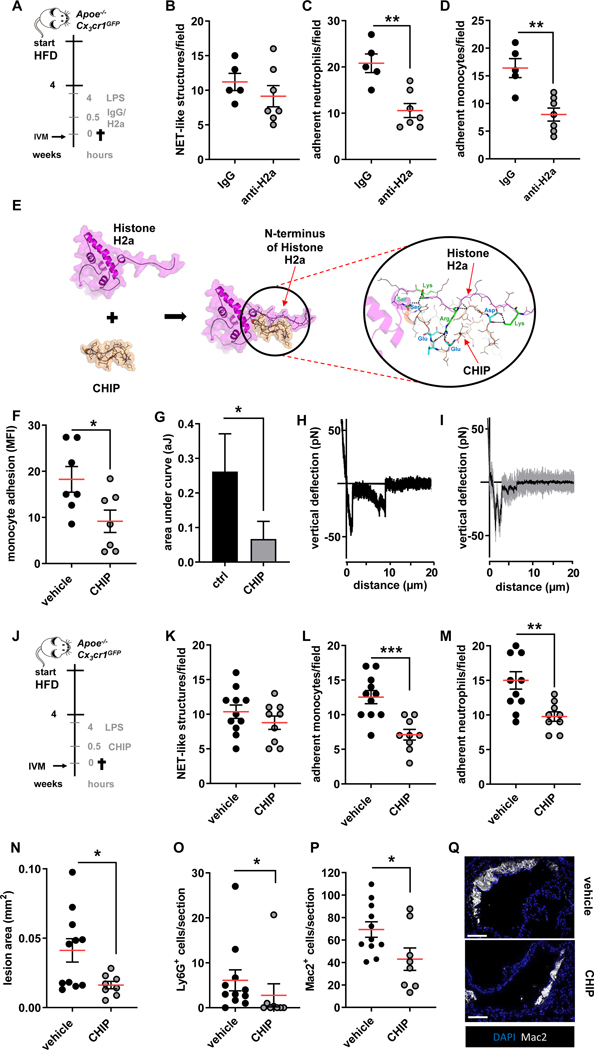
Figure 4: Neutralization of histone H2a inhibits endotoxin-induced arterial myeloid cell recruitment and atheroprogression.
(A) Experimental outline. Apoe−/−Cx3cr1GFP were fed a HFD for 4 weeks, treated with LPS (1 mg/kg, 4h) and injected with isotype respective control (IgG), or a histone H2a-targeting antibody (anti-H2a). (B-D) Intravital microscopy was used to quantify luminal NET-like structures (B) in the left carotid artery as well as adherent neutrophils (C) and monocytes (D).(E) The structure of histone H2a (magenta), CHIP (orange) and the histone H2a-CHIP complex which was derived from protein-protein docking and molecular dynamic simulation. CHIP bound and interacted with the N-terminal part of histone H2a. The electrostatic interactions between Arg or Lys of Histone H2a (green sticks) with Glu or Asp of CHIP (cyan sticks) as well as hydrogen bonds (displayed as dash lines) help to stabilize the complex formation between histone H2a and CHIP. (F-I) Pharmacological interruption of histone H2a monocyte-binding was validated in static adhesion assays (F) as well as by single cell force spectroscopy (G-I). (J-Q) In vivo validation of therapeutic effect of CHIP in endotoxin-accelerated atherosclerosis. (J) Experimental outline. Apoe−/−Cx3cr1GFP were fed a HFD for 4 weeks, treated with LPS (1 mg/kg, 4h) and injected with vehicle or CHIP (5 mg/kg). (K-M) Intravital microscopy was used to quantify luminal NET-like structures (K) in the left carotid artery as well as adherent neutrophils (L) and monocytes (M). (N) Aortic root lesion size analyzed after HE staining. Quantification of Lesional neutrophils (Ly6G+ cells) (O), and macrophages (Mac2+ cells) (P). (Q) Representative immunofluorescence images showing lesional Mac2+ cells (grey) and nuclei (DAPI, blue), scale bar 50 μm. Data are analyzed by Mann-Whitney test (B, C, D, F, G, O) or unpaired t-test (K-M, N, P); *p≤0.05, **p≤0.01, ***p≤0.001. All data are presented as mean ±SEM.

