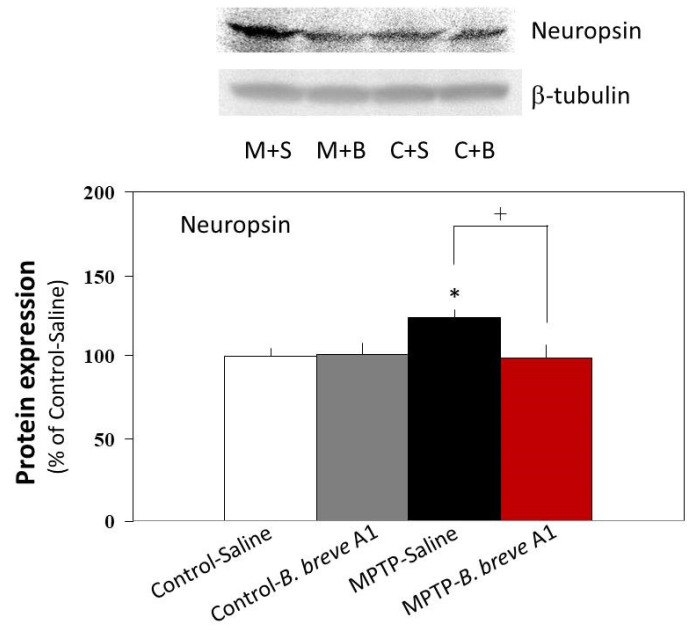
Figure 8.
Neuropsin protein expression levels in saline-administered controls and PD mice, and in B. breve A1-administered controls and PD mice. The images show representative results (upper: neuropsin, lower: β-tubulin). The protein levels were normalized to β-tubulin as a loading control. Results are shown as a percentage of protein expression levels in Control + Saline. Data are expressed as the mean ± SEM: n = 5 per group. * p < 0.05 vs. Control + Saline and † p < 0.05: between MPTP + Saline and MPTP + B. breve A1.

