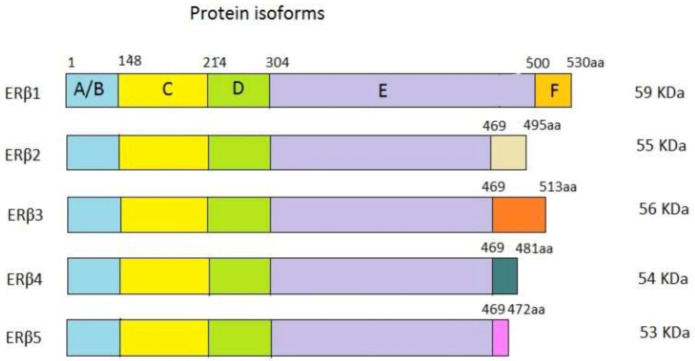
Figure 2.
ERβ isoforms—the wt protein isoform ERβ1 and the other isoforms from ERβ2 to ERβ5. The boxes indicate protein domains. The numbers above the boxes represent the sizes of domains (the number of amino acids). The numbers on the right side of the isoforms indicate the molecular weight of every isoform in kDa. The figure is modified under CC BY NC, based on [17].

