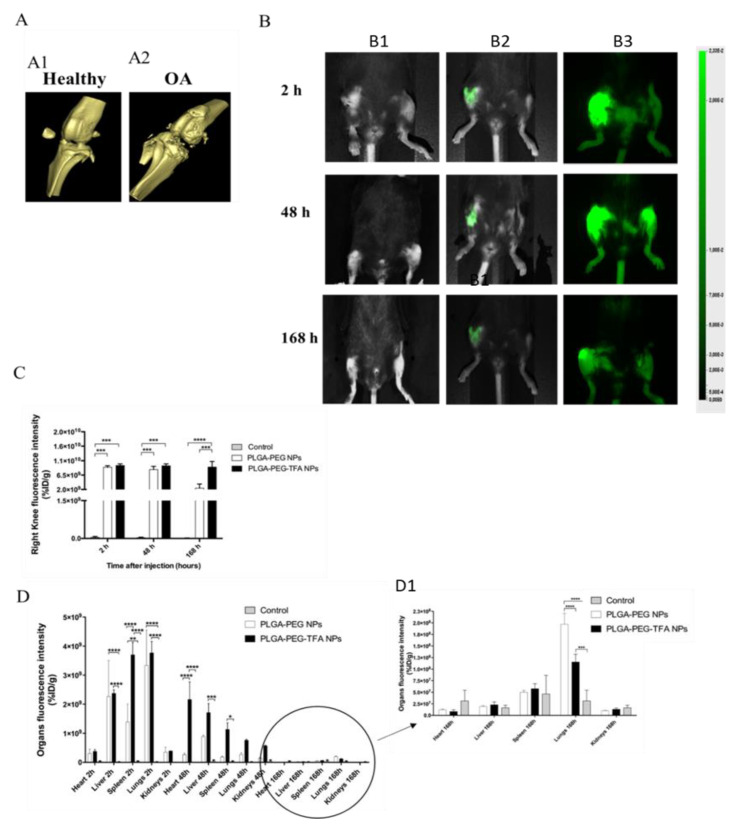
Figure 6.
Representative mouse knee images in Ex-vivo and In-vivo. (A) Ex vivo µCT- scan of knee joints showing a 3D view of the cartilage surface. (A1) scan of healthy knee joint (negative control group) and (A2) scan of OA knee joint after 3 weeks of destabilization of medial meniscus (DMM) induction (positive control group). (B) In vivo images using the Pearl Image System were acquired at 800 nm. Mice received intra-articular (IA) injection of these NPs after DMM induction. From top to bottom, 800 nm scan of mice 2, 48, and 168 h after injection with PLGA-PEG NPs and PLGA-PEG-TFA NPs (in green). (B1) control group, (B2) PLGA-PEG NPs group and (B3) PLGA-PEG-TFA NPs group. (C) Quantification of fluorescent NP release in the knee joints at three time points. (D) Biodistribution of fluorescent NPs in main organs at three time points. (D1) Zoom image of biodistribution of fluorescent NPs in main organs 168 h post-injection. Asterisks indicate significant difference in two-way ANOVA, * p < 0.05, ** p < 0.01, *** p < 0.001 and **** p < 0.0001.

