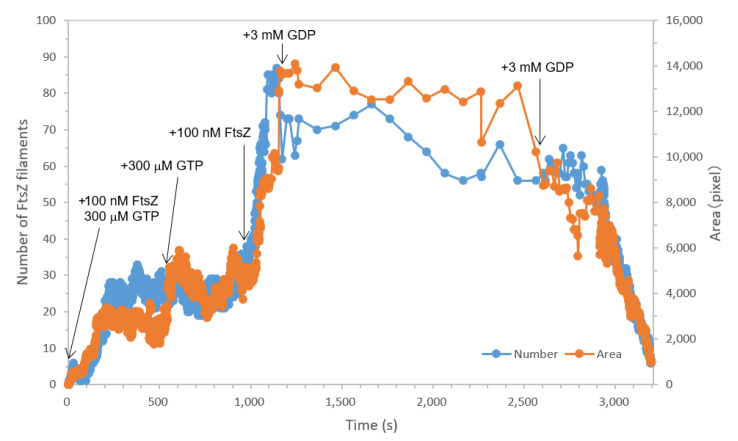
Figure 3.
Time-course graph of the number (blue) of FtsZ filaments and the area (orange) covered with FtsZ filaments shown in Figure 2. Note that the time course is not completely continuous because of the intervals for adding samples and changing settings.

