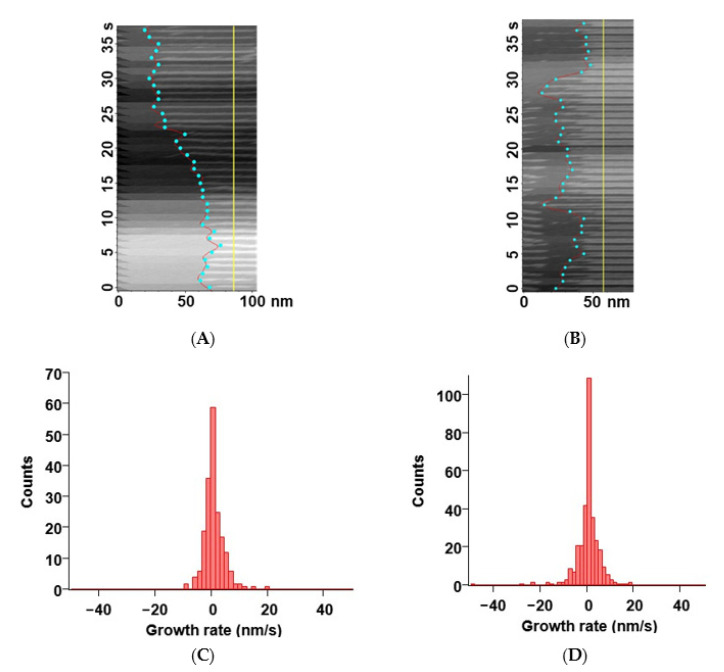
Figure 4.
Growth and dissociation rates of FtsZt filaments: (A,B) Typical kymographs of a single FtsZt filament in the growth condition (A) and the dissociation condition (B). Cyan circles represent the position of filament ends on each frame. Yellow line shows the base line for the measurement of length. The time axis goes from the bottom to the top; (C,D) Histograms of growth/dissociation rates of FtsZt filaments in the growth condition (C) and the dissociation condition (D). Scale bars: 50–100 nm.

