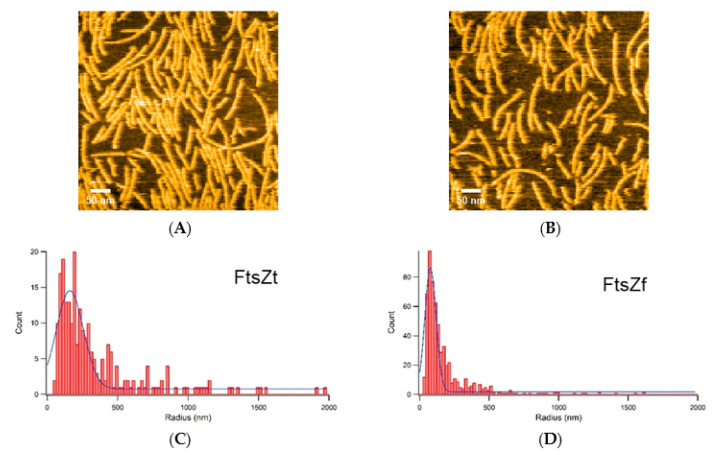
Figure 5.
Curvature analysis of FtsZt and FtsZf filaments: (A,B) An image of FtsZf filaments taken under the following conditions: (A) 100 nM FtsZf and 600 μM GTP; (B) 100 nM FtsZf, 600 μM GTP, and 6 mM GDP; (A,B) show different fields of view; (C,D) Histograms of radius calculated by regarding the FtsZt (C) and FtsZf (D) filaments as arcs. Scale bars: 50 nm.

