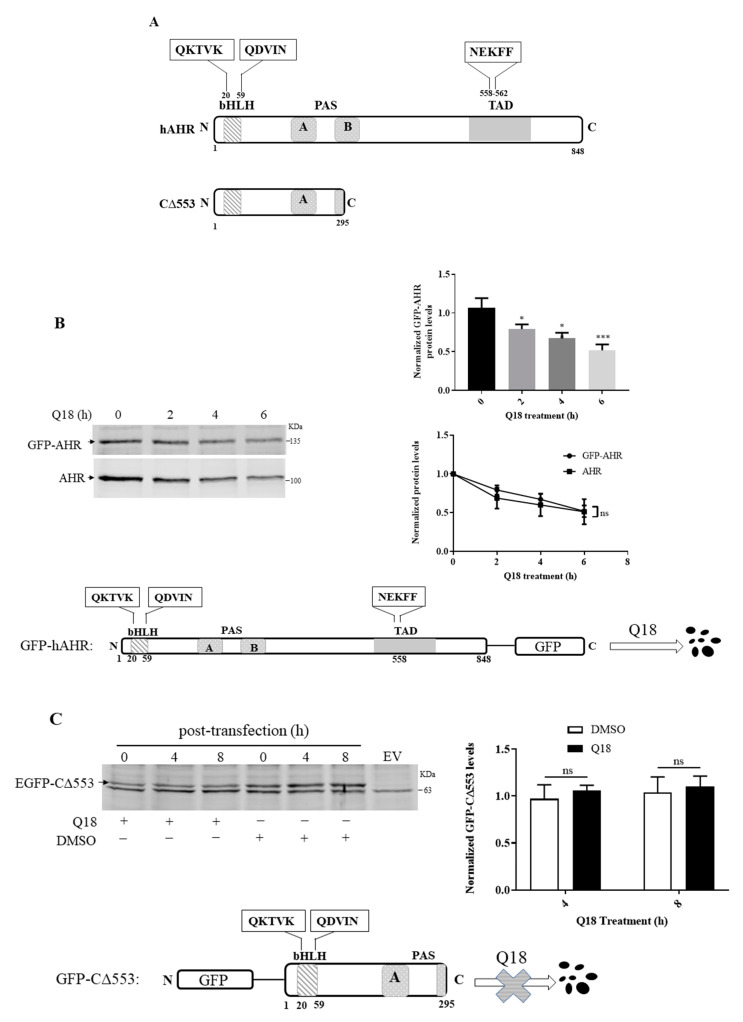
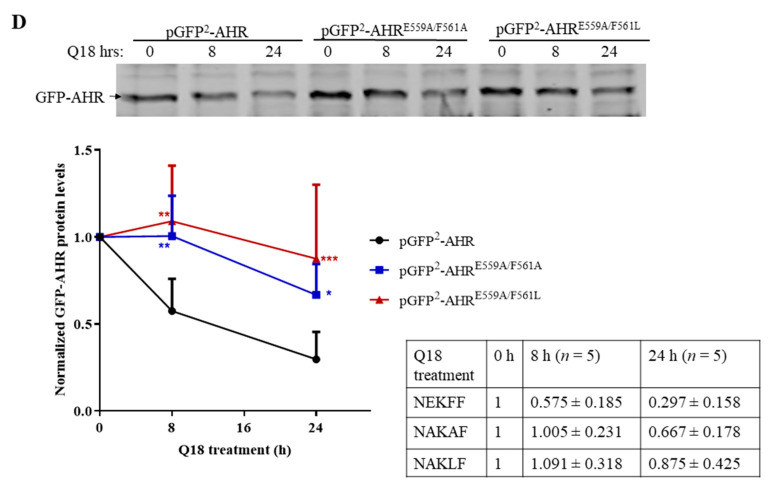
Figure 7.
Identification of CMA motif of human AHR. (A) Schematic of human AHR (hAHR) and AHR construct CΔ553 indicating the location of the three putative CMA motifs: QKTVK, QDVIN, and NEKFF. (B) MDA-MB-468 cells were transiently transfected with pGFP2-N2-AHR. Cells were then treated with 10 μM of Q18 for 0–6 h. Results are means ± SD of three independent experiments. One-way ANOVA with Dunnett’s multiple comparisons test (bar graph) and two-way ANOVA with Sidak’s multiple comparisons test (line graph) were used for statistical analysis. * p < 0.05, ** p < 0.01, and *** p < 0.001 when compared with zero timepoint. ns, not significant. There is no difference between GFP-AHR and endogenous AHR degradation. Bottom diagram and top left images show the degradation of the transfected GFP-AHR upon Q18 treatment in MDA-MB-468 cells. The amount of AHR and GFP-AHR was normalized by total protein stain, whereas each lane contained 60 μg of protein loaded. (C) MDA-MB-468 cells were transiently transfected with pEGFP-C2-C∆553 or pEGFP-C2 plasmid (empty vector, EV). Cells were treated with 10 μM of Q18 or DMSO (vehicle) for 0–8 h. The graph represents the normalized amount of GFP-CΔ553 at 4 and 8 h after Q18 or DMSO treatment with the amount at zero hour set as one. Results are means ± SD of three independent experiments. Unpaired t test was used for statistical analysis. There is no difference between Q18 and vehicle treatment. EGFP-CΔ553 was stable in the presence of Q18 for up to 8 h. (D) MDA-MB-468 cells were transiently transfected with pGFP2-N2-AHR (NEKFF, black), pGFP2-N2-AHRE559A/F561A (NAKAF, blue), or pGFP2-N2-AHRE559A/F561L (NAKLF, red) and then treated with 10 μM of Q18 for 0, 8, or 24 h. Both NAKAF and NAKLF mutants were statistically more stable than GFP-AHR with NEKFF in the presence of Q18. Results are means ± SD (with error bars of above half only) of five independent experiments, except that the 24 h transfection of pGFP2-N2-AHR (black) and pGFP2-N2-AHRE559A/F561L (red) was from six independent experiments. The table represents the mean values ± SD with zero timepoints set as one for comparison. Two-way ANOVA with Turkey’s multiple comparisons test was used for statistical analysis. * p < 0.05, ** p < 0.01, and *** p < 0.005 when compared with pGFP2-N2-AHR-transfected cells.


