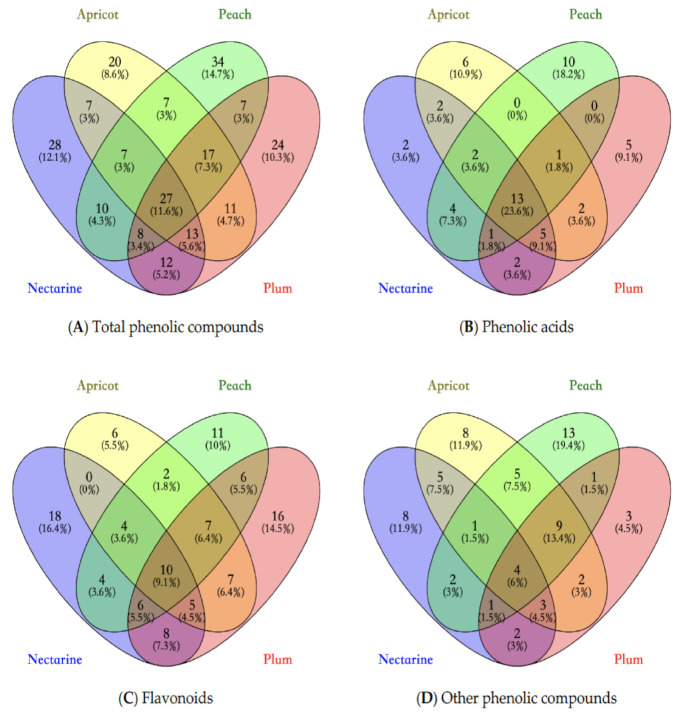
Figure 1.
Venn diagram of phenolic compounds presented in stone fruits waste samples. (A) shows the relations of total phenolic compounds present in stone fruits waste; (B) shows the relations of phenolic acids in present in stone fruits waste; (C) shows the relations of flavonoids present in stone fruits waste; (D) shows the relations of other phenolic compounds present in stone fruits waste.

