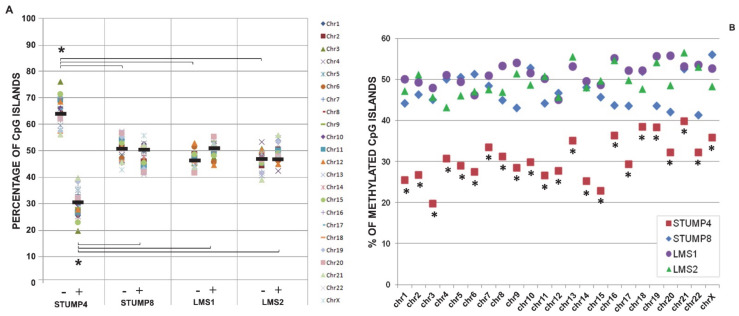
Figure 2.
Methylation results. (A) Frequency of unmethylated (−) and methylated (+) CGIs for each sample. The methylation status for each chromosome is reported. Mean values are indicated with black dashes. STUMP4 vs. other samples * p < 0.01, Student’s t test. (B) Frequency of methylated CGI islands for each chromosome in each sample. STUMP4 vs. other samples * p < 0.01, Chi-square test.

