Figure 1.
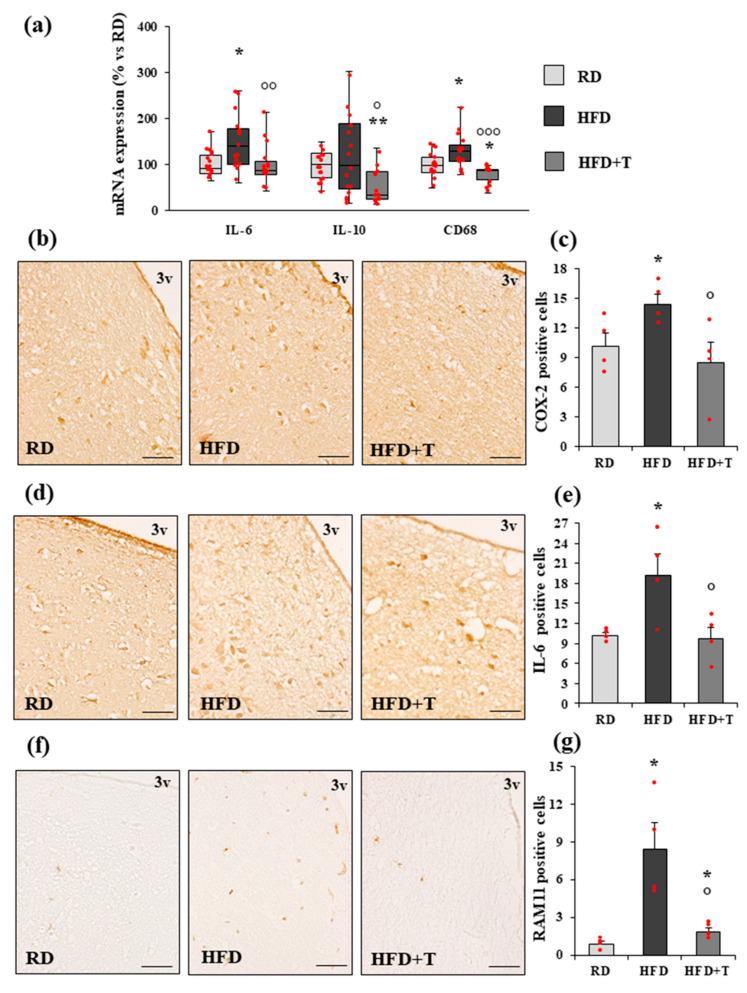
Real-time RT-PCR and immunohistochemical analysis of inflammation markers in rabbit hypothalamus. (a) Messenger RNA (mRNA) expression of interleukin IL-6, IL-10, and CD68 genes in RD, HFD, and HFD + T rabbit hypothalamic samples. Data were calculated using the 2−ΔΔCt comparative method, with the 18S ribosomal RNA subunit used as a housekeeping gene for normalization, and they are reported as a percentage vs. RD as the median ± interquartile range (n = 16 for RD, n = 15 for HFD, n = 14 for HFD + T). Statistical analysis between groups was performed with Kruskal–Wallis and post hoc Mann–Whitney nonparametric tests. (b–g) Representative images of cyclooxygenase-2 (COX-2) (b), IL-6 (d), and macrophage-specific RAM11 (f) staining of coronal hypothalamic sections, including the region lining the third ventricle (3v) (scale bar = 50 μm). The bar graphs show the quantification of COX-2 (c), IL-6 (e), and RAM11 (g) positive cells obtained by counting 10 fields in four different samples from each group (mean ± standard error of the mean (SEM), n = 4 for each group). * p < 0.05, ** p < 0.01 vs. RD; ° p < 0.05, °° p < 0.01, °°° p < 0.001 vs. HFD.

