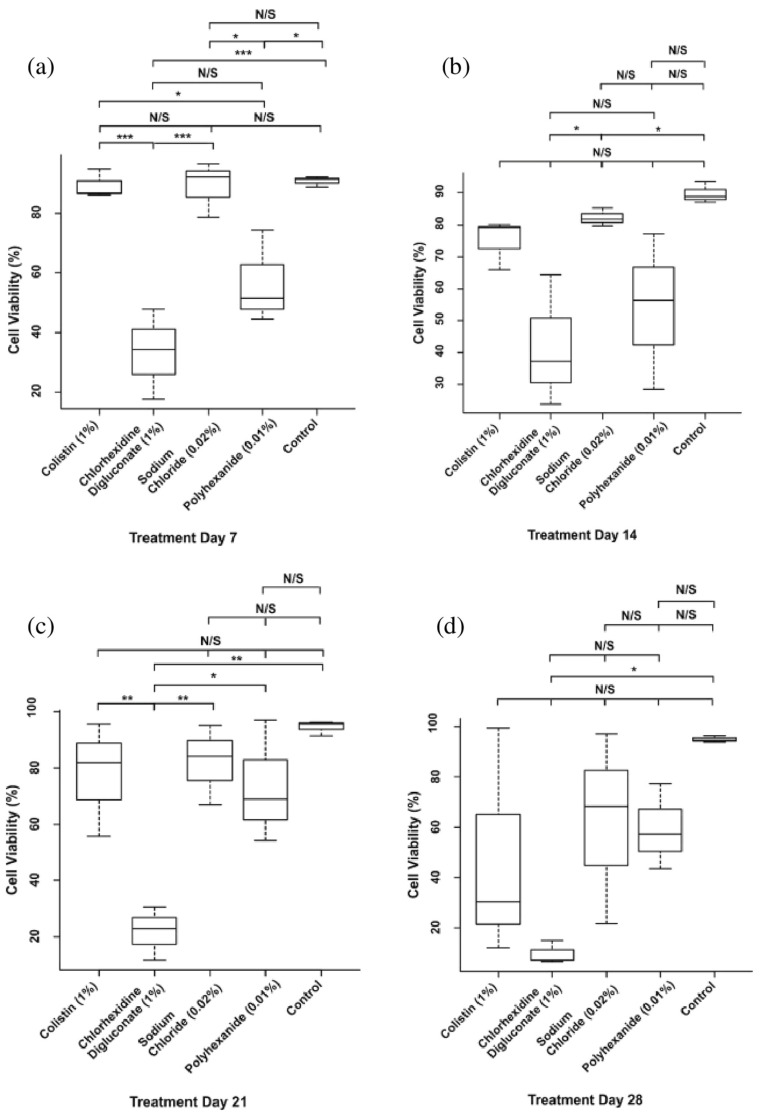
Figure 7.
Statistical analysis of the days of treatment in the antiseptic/antibiotic viability (Table 1) treatment. Boxplot of cell viability percentage at (a) day 7, (b) day 14, (c) day 21, and (d) day 28 of treatment. N/S: no significant differences; * p ≤ 0.05; ** p ≤ 0.01; *** p ≤ 0.001. n = 3. The values of p ≤ 0.05 were considered statistically significant.

