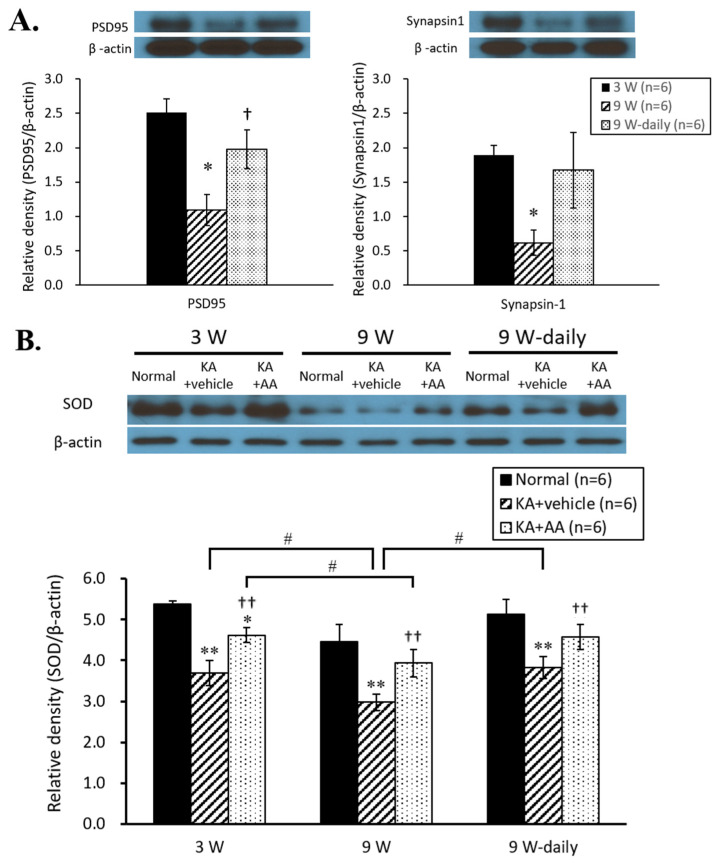
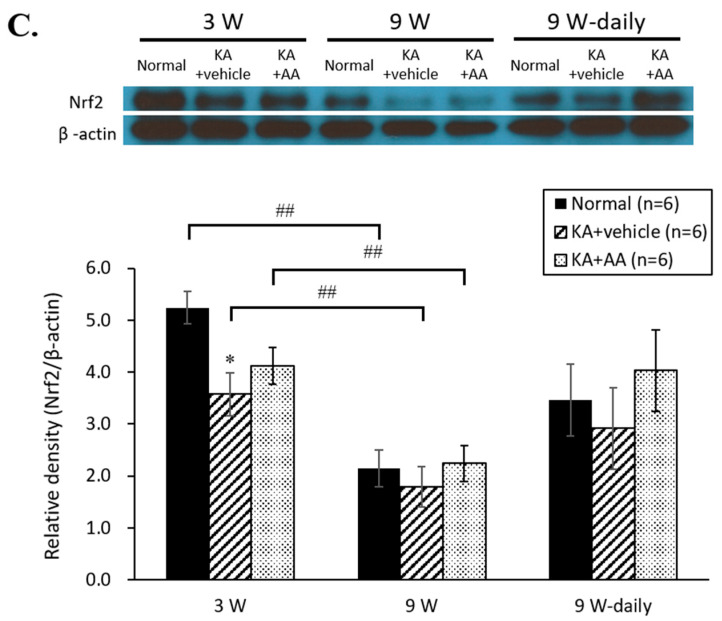
Figure 3.
(A) Changes in synaptic protein expression by culture time of OHSCs. PSD 95 and synapsin-1 expression levels significantly reduced at 9 w compared to 3 w. In the chronic AA treatment group, the expression levels of PSD 95 and synapsin-1 proteins showed a significant difference between 9 w and 9 w-daily groups. (B) Western blot analysis of SOD and Nrf2 in OHSCs following oxidative injury. The expression of SOD in the vehicle group was significantly reduced compared to the normal group. The expression of SOD significantly increased 24 h after 500 µM AA treatment in the 3 w and 9 w groups, compared to the vehicle group. The chronic AA treatment (9 w-daily) group showed higher SOD expression than the 9 w group. (C) The expression level of Nrf2 increased in the AA treatment group compared to the vehicle group at 3 w. The 9 w group showed no difference in Nrf2 expression between the AA treatment and vehicle groups. However, Nrf2 expression was significantly decreased in both AA treatment and vehicle groups at 9 w compared to 3 w. In 9 w-daily groups, Nrf2 expression tended to increase compared to 9 w. The horizontal axis indicates each experimental group (3 w, 9 w, and 9 w-daily AA treatment), and the vertical axis represents the normalized level of each protein expression (ratio of each antibody expression/β-actin expression). * p < 0.05, ** p < 0.01 compared to normal, † p < 0.05, †† p < 0.01 compared to vehicle, # p < 0.05, ## p < 0.01 comparing different time points: two-way ANOVA followed by Tukey’s post hoc comparison.


