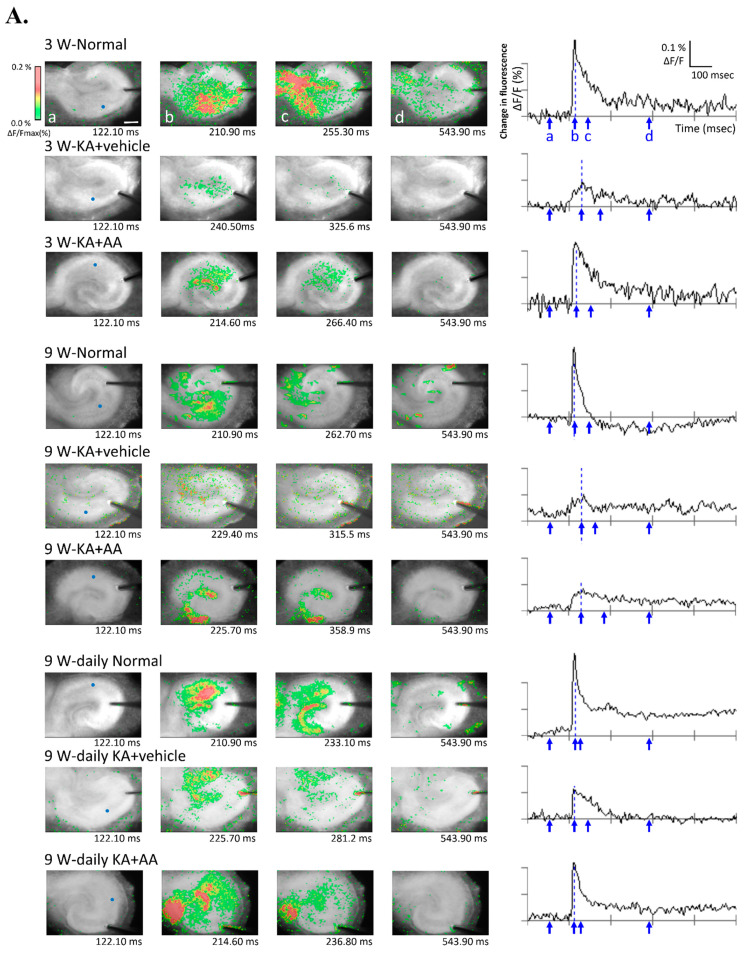
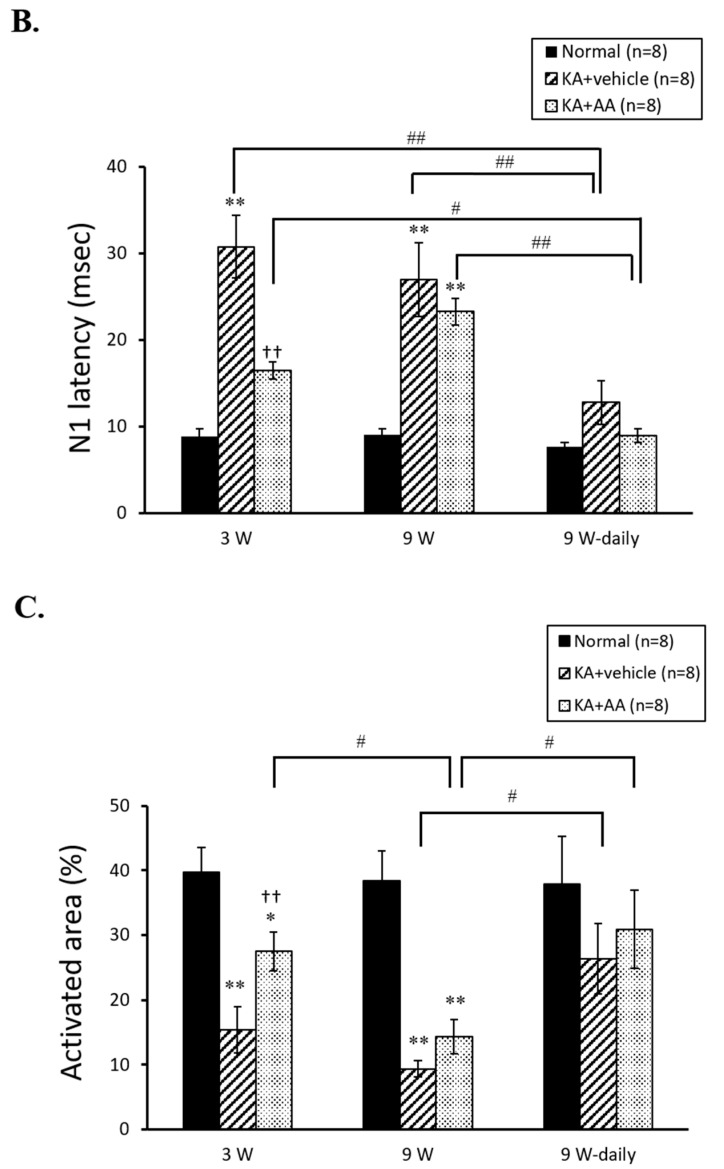
Figure 4.
Optical recordings were conducted with a voltage-sensitive dye (VSD) in hippocampal slices to assess AA treatment effects. (A) Representative pseudo-color optical images show the evoked excitatory neuronal signals and typical spatiotemporal changes that were observed in OHSCs after electrical stimulation. Each frame of the pseudo-color image (left side) is presented by an arrow below the wave form (right side) at each time point (a, before stimulation; b, peak of N1; c, half of the N1; d, post stimulation). The X-axis shows the time (msec), and the y-axis shows the percent change in fluorescent intensity (% ΔF/F). The blue grid line shows the peak of the negative (N1) point, which was used to quantify the N1 latency. A colored scale (color calibration) shows the changes in optical signals (upper-left side). Signal transmission indicating spatiotemporal changes showed an increase in neuronal activity through long-lasting depolarization. The KA + vehicle groups at each time point showed a few signs of activation, only in the focal stimulation area. Spatiotemporal changes, reflecting the distribution of neuronal activity, increased after AA treatment. (B) Comparisons of optical signals in the different experimental groups by latency, an indication of basal synaptic transmission. Latencies were significantly delayed in the vehicle groups compared to normal groups at each time point. The latency of the optical signals was decreased in AA-treated hippocampal slices compared to the vehicle group at 3 w. For chronic AA treatment, there was a significant difference between the 9 w and 9 w-daily groups. (C) Quantification of pseudo-color activated areas that indicate neuronal activities through neural propagation. The activation area was decreased in the vehicle groups compared to the normal groups at each time point. In particular, the chronic AA-treated 9 w-daily group showed a significantly greater increase in activation area compared to the acute 9 w group. * p < 0.05, ** p < 0.01 compared to normal, †† p < 0.01 compared to vehicle, # p < 0.05, ## p < 0.01 comparing different time points: two-way ANOVA followed by Tukey’s post hoc comparison. Scale bar: 500 µm.


