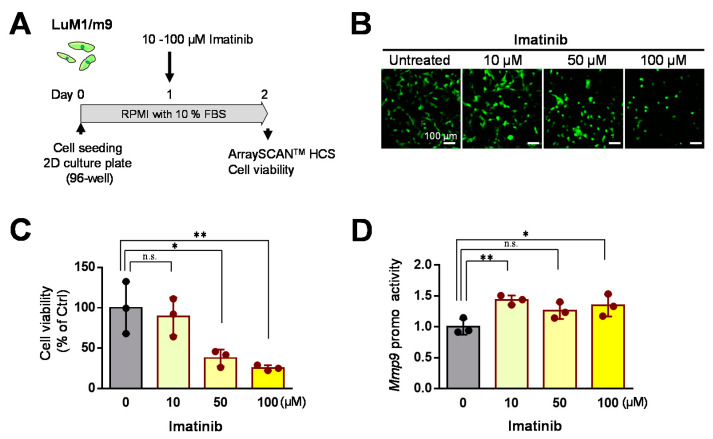
Figure 5.
Effects of Imatinib on LuM1/m9 cells in the 2D culture system: (A) a scheme of the experimental protocol. Cells were treated with 10, 50, or 100 μM Imatinib or untreated; (B) representative fluorescence images of LuM1/m9 cells; (C) Mmp9 promoter activities. n = 3 independent culture wells; (D) cell viability. n = 3 independent culture wells. * p < 0.05, ** p < 0.01. n.s., not significant.

