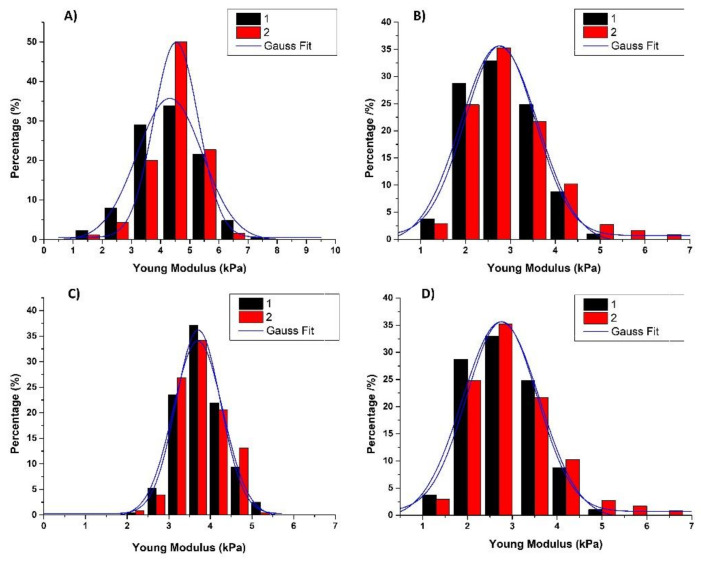
Figure 8.
Elasticity histograms of neuroblastoma SH-SY5Y cells from two independent measurements using force spectroscopy: (A) control cells, (Ncell = 8), Nfc = 440; (B) cell treated with 10 μg/mL myricetin for 24 h, (Ncell = 8), Nfc = 480; (C) cells treated with copper (0.5 mM CuSO4) for 24 h, (Ncell = 8), Nfc = 480; (D) cells treated with myricetin and copper for 24 h, (Ncell = 8), Nfc = 480. Histograms were fitted with the Gauss function, indicated by blue lines.

