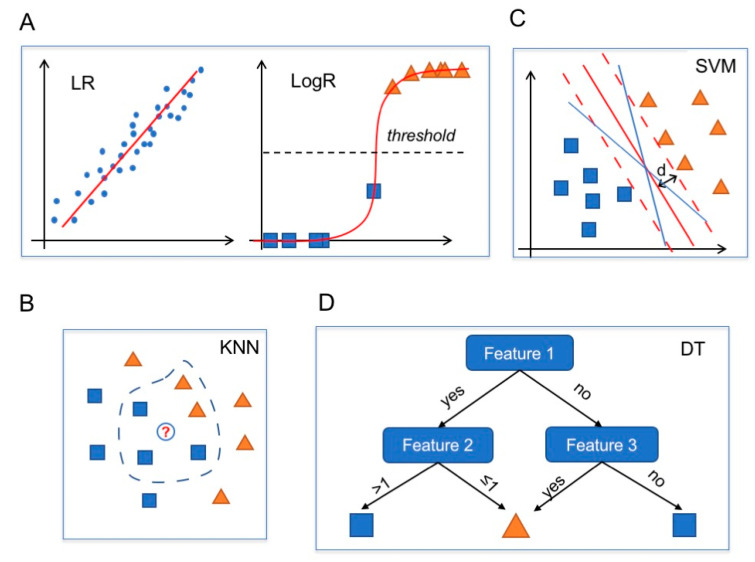
Figure 4.
Commonly used computational models. Blue dots, blue squares and orange triangles represent data. (A) Linear regression (LR) model (left): the red line is the linear estimator obtained from the fit of the data. LogR model (right): the red line is the logistic model (a squashed linear regression) and the black dotted horizontal line is the threshold value. (B) A KNN algorithm with k = 5 classifies the white circle (new data) as a blue square, like the majority of the five nearest neighbors. (C) A linear SVM classifier identifies the max-margin hyperplane (red line; dashed lines indicate the boundaries; d = maximal distance) among all the possible separating hyperplanes (blue and red lines). (D) Decision tree of depth 2. An instance is classified as a blue square if feature 1 is “yes” and feature 2 > 1 or if both feature 1 and 3 are “no”. In all the other cases, the instance is classified as an orange triangle.

