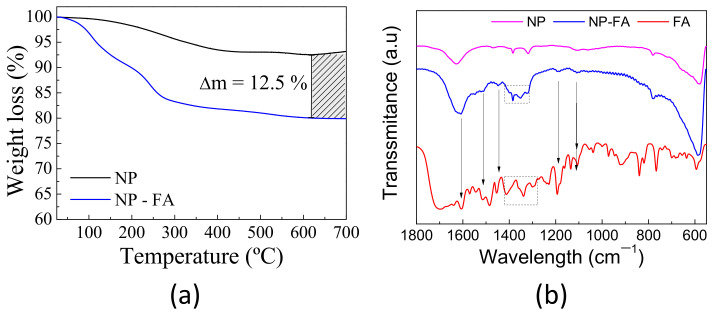
Figure 1.
(a) Thermogravimetric analysis of bare nanoparticles (NP) (black line) and nanoparticle-folic acid (NP-FA) (blue line) under air conditions. The striped square is a guide for eyes to highlight the difference in weight loss between samples. (b) FTIR spectrum of bare NPs, NPs functionalized with folic acid, and the FA molecule.

