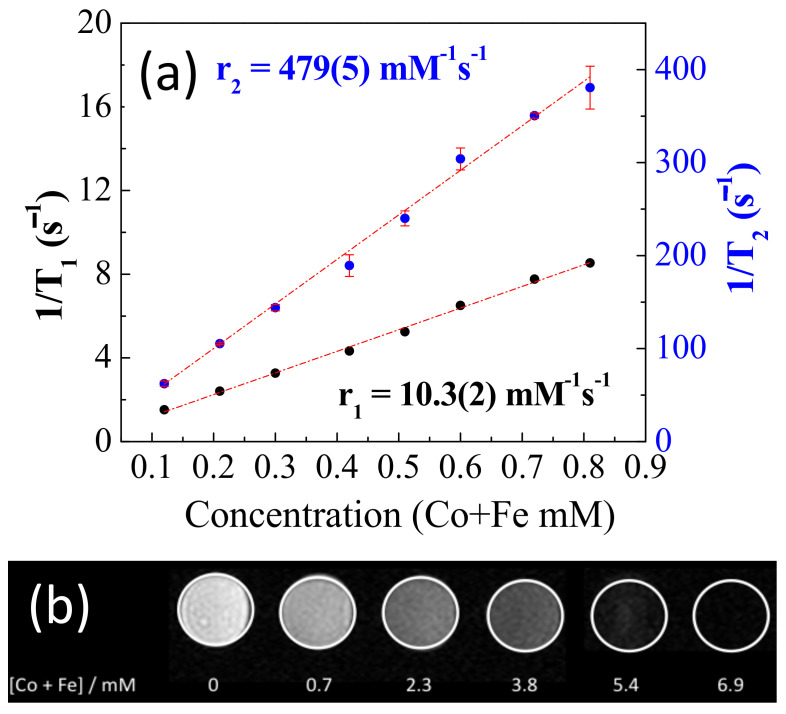
Figure 4.
(a) T1 and T2 inverse measurements vs. cobalt and iron millimolar concentration. The slope of these curves corresponds to r1 and r2 relaxivities. (b) T2-weigthed magnetic resonance (MR) images of NP-FA in aqueous solution at various metal concentrations using a Varian 7T micro magnetic resonance imaging (MRI) scanner.

