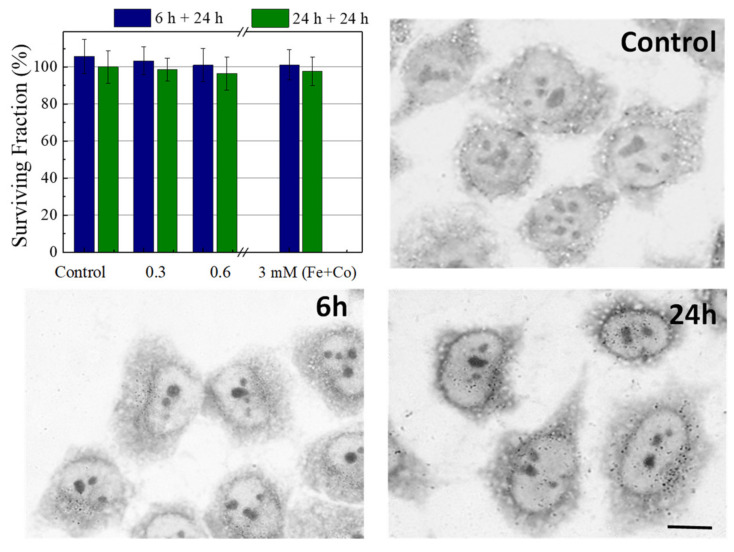
Figure 5.
Bars diagram of biocompatibility of NPs functionalized with folic acid in HeLa cells measured by MTT assay. Blue columns, cells incubated 6 h with different concentrations of NPs and their viability measured 24 h later. Green columns, cells incubated for 24 h and their viability measured 24 h later. The results represent the average of 6 independent experiments. Optical micrographies of control cells, NP-FA 0.6 mM internalization in HeLa cells incubated for 6 and 24 h. Scale bar 10 µm.

