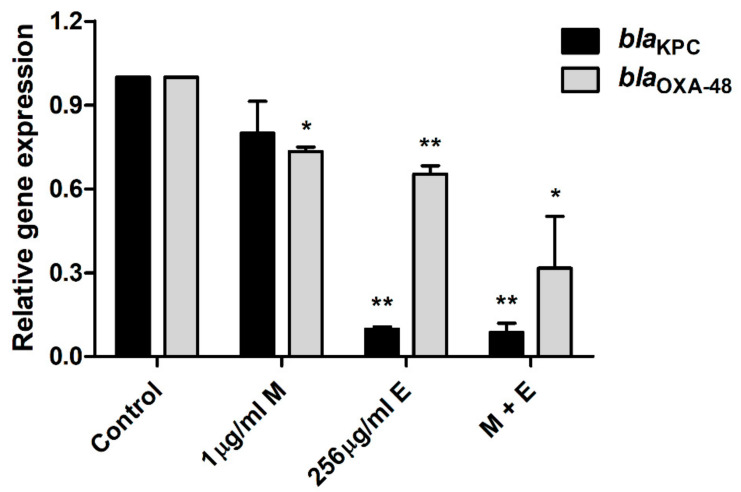
Figure 4.
Transcriptional changes in the carbapenemase-related E. coli genes. After treatment with equol alone (256 μg/mL), meropenem alone (1 μg/mL), and the combination of 1 μg/mL of meropenem plus 256 μg/mL of equol, qPCR analysis of blaKPC and blaOXA-48 genes in E. coli KBN12P05816 was performed. 16SrRNA was used to normalize the transcriptional levels of the target genes. The expression levels of the genes are expressed as fold-changes compared to the control and analyzed using the Student’s t-test. The error bars represent the means and standard deviations (SDs). Asterisks (*) indicate statistically significant differences (* p < 0.05 and ** p < 0.01) from the control.

