
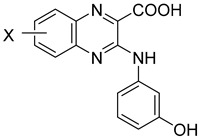
Table 1.
Enzymatic assays on HsPim-1 and HsPim-2 (ADP-Glo method at 10 μM ATP).
| ||||
|---|---|---|---|---|
| Entry | Compound | X |
HsPim-1 IC50 (µM) 1 |
HsPim-2 IC50 (µM) 1 |
| 1 | 1 | H | 0.074 | 2.10 |
| 2 | 5a | 6-F | 0.17 | 0.76 |
| 3 | 5b | 7-F | 1.24 | 4.20 |
| 4 | 5c | 6-Cl | 0.13 | 0.17 |
| 5 | 5d | 7-Cl | 2.10 | 2.40 |
| 6 | 5e | 6-Br | 0.16 | 0.58 |
| 7 | 5f | 7-Br | 0.18 | 2.20 |
| 8 | 5g | 6-CF3 | 0.20 | 1.80 |
| 9 | 5h | 7-CF3 | 3.85 | 6.40 |
| 10 | SGI-1776 | 0.05 | 0.10 | |
1 IC50 on Pim-1/2 kinase activity were calculated from dose−response curves. Each inhibitor concentration was tested in duplicate. Inhibition curves for 5c and 5e are reported in supplementary data. Hs: Homo sapiens. Values are a mean of n ≥ 3 independent experiments. Hs: Homo sapiens.