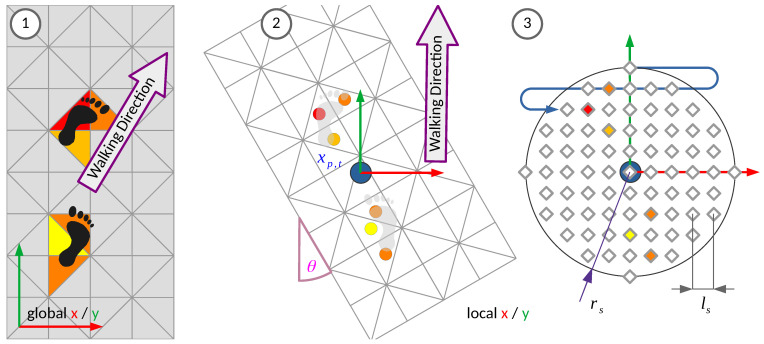
Figure 2.
Transformation of the capacitance measurements into the local coordinate system of the tracked person and resampling. 1. Sensor activations in the global coordinates, with examples of how a foot on the floor influences the measured capacitances (grey = unoccupied, yellow to red = level of electric capacitance). 2. The sensor state is translated to the tracked position and rotated into the walking direction by walking angle . 3. The sensor activations are resampled to the grid that is shown with the diamonds, which is defined by the sampling resolution and radius . The sample point that is closest to a transformed sensor field centroid takes its capacitance value. Then, the grid is reshaped into vector form as shown by the meandering blue arrow.

