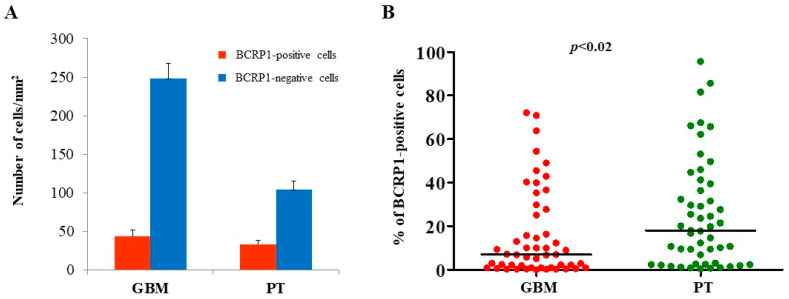
Figure 3.
Stereological analysis of BCRP1 expression in both GBM and PT areas. Immunohistochemistry results were further evaluated by subjecting histological slides to an unbiased stereological analysis. Both BCRP1-labeled and unlabeled cells were counted, and the cell density of BCRP1 was graphed. (A) Red and blue bars show the number of BCRP1 cells/mm2. The data are presented as the mean ± SE. (B) Plots show the percentage of positive cells in GBM and PT areas. N = 50; the horizontal line represents the median value; p indicates the result of the Mann-Whitney test.

