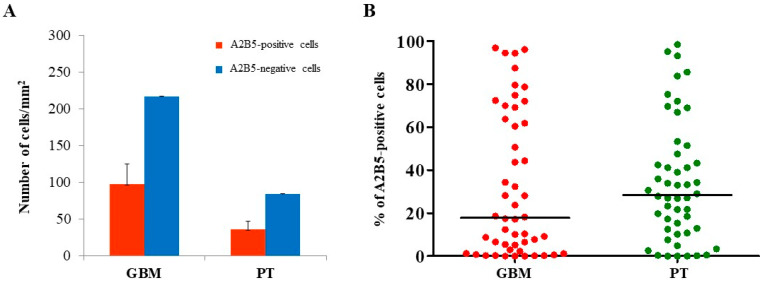
Figure 4.
Stereological analysis of A2B5 expression in both GBM and PT areas. To more accurately evaluate the immunohistochemistry results, an unbiased stereological technique was used. Within each selected region of interest (ROI), the number of both immunopositive and immunonegative cells were used to estimate the expression density of A2B5 in the indicated histological areas. (A) Red and blue bars show the number of A2B5-positive and A2B5-negative cells/mm2, respectively. The data are presented as the mean ± SE. (B) Plots show the percentage of A2B5-positive cells in GBM and PT areas. N = 50; the horizontal line represents the median value; p indicates the result of the Mann-Whitney test.

