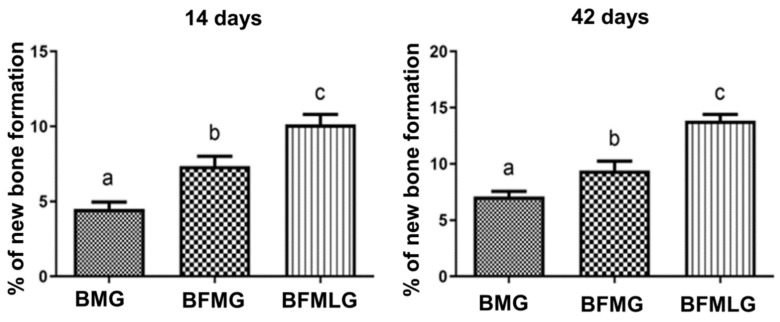
Figure 5.
Percentage of new bone formation in each group (BMG, BFMG, and BFMLG) in the two experimental periods (14 or 42 days). Different lowercase letters indicate a significant difference. Values defined as the mean ± standard deviation (p < 0.05), ANOVA test for independent samples and the “post hoc” Tukey’s test (p < 0.0001).

