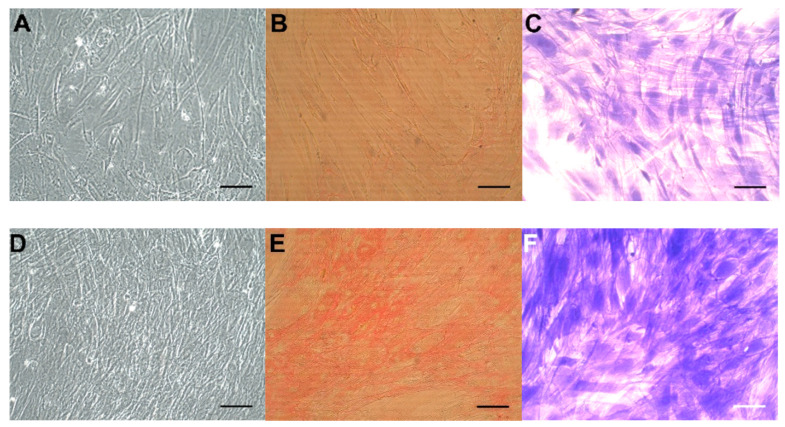
Figure 5.
CoReFs treated without (A–C) or with 1 ng/mL TGF-β1 for 8 days (D–F), fixed and stained with Sirius red (B,E) or crystal violet (C,F). OD540nm for (B) was 0.22, and for (E) was 0.59. OD590nm for (C) was 0.54 and for (F) was 1.46. Scale bars, 100 µm. Cells in (A) and (D) were trypsinized (2 mL 0.05% trypsin-0.02% EDTA/well for 10 min at 37 °C) and counted by a Countess™ automated cell counter (Thermo Fisher Scientific, Waltham, MA, USA). The number of cells in (A) was 0.77 × 10⁶ and in (D) was 1.2 × 10⁶.

