Figure 5.
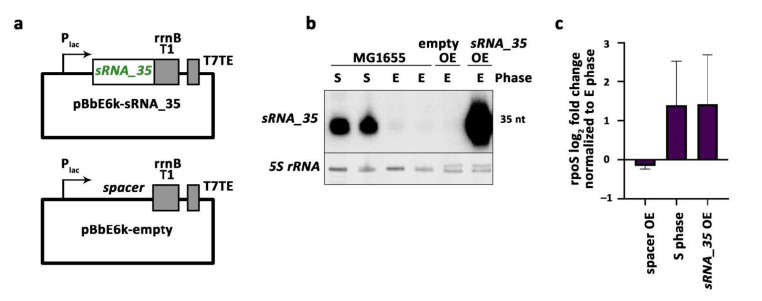
Overexpression of sRNA_35 upregulates rpoS expression. (a) Schematic representation of constructed plasmids for sRNA_35 (top) and control (bottom) overexpression. Plac = lac operon promoter, inducible by IPTG. rrnB T1 and T7TE are terminator sequences. (b) Northern blot analysis of sRNA_35 (intergenic sRNA). E = exponential phase, S = stationary phase, OE = overexpression. Predicted sizes are displayed on the right in nt (nucleotides). (c) RT-qPCR mean and SEM for rpoS expression under different conditions (two biological replicates each). E = exponential phase, S = stationary phase, OE = overexpression. log2 fold change is reported for all conditions in comparison to exponential phase condition.

