Figure 1.
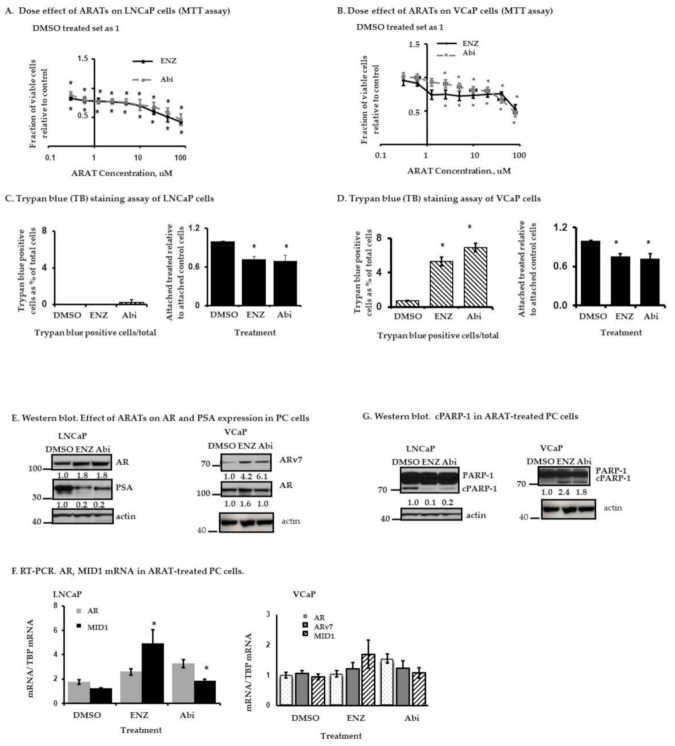
Effect of enzalutamide (Enz) and abiraterone (Abi) on LNCaP and VCaP cells. (A,B) 3-(4,5-dimethylthiazol-2-yl)-2,5-diphenyltetrazolium bromide (MTT) assay. Cells were treated with increasing doses of Enz or Abi for 3 days. Shown are the fractions of viable treated cells relative to control (DMSO-treated) cells, as determined by MTT assay. Results represent the mean ± standard deviation (S.D.) from three separate experiments, each done with triplicate determinations per data point. (* p < 0.05), Student’s t-test. (C,D) Trypan blue staining. Cells were treated with Enz 10 µM, Abi 5 µM or DMSO (control) for 5 days and stained with trypan blue. Both floating and attached cells were collected. Floating cells generally represent dead cells (uniformly stained with trypan blue), while attached cells are not yet dead (exclude trypan blue). (C) Left. LNCaP floating cells are shown as a percentage of total treated cells (floating + attached) within each plate. Right. Drug-treated LNCaP attached cells are shown as a fraction of attached control (DMSO-treated) cells, which was set at 1. (D) Left. VCaP floating cells are shown as a percentage of total treated cells (floating + attached) within each plate. Right. Drug-treated VCaP attached cells as a fraction of attached control (DMSO-treated) cells, which was set at 1. Results represent the mean ± S.D. from three separate experiments, each done with triplicate determinations per data point. (* p < 0.05), Student’s t-test. (E) Western blot. Androgen receptor (AR), ARv7, and prostate serum antigen (PSA) expression in PC cells treated with Enz 10 µM or Abi 5 µM for 5 days. (F) RT-PCR. Relative AR, ARv7, and MID1 mRNA expression in 5 day-treated PC cells. The specific mRNAs were normalized with the respective TATA-box-binding protein (TBP) mRNA in the drug-treated or DMSO (control)-treated cells. Results represent the mean ± S.D. from three separate experiments, each done with duplicate determinations per data point. (* p < 0.05), Student’s t-test. (G) Western blot. PARP-1 and cPARP-1 expression in PC cells treated for 5 days with Enz or Abi. Results are representative of two separate experiments. The original western blot figures are available in a separate Supplementary Materials document. In (E) and (G), the actin loading controls for the respective LNCaP and VCaP western blots are identical since they are part of the same original blots probed with different antibodies of interest; the figures are organized as shown to better align with the data presented in the Results Section.

