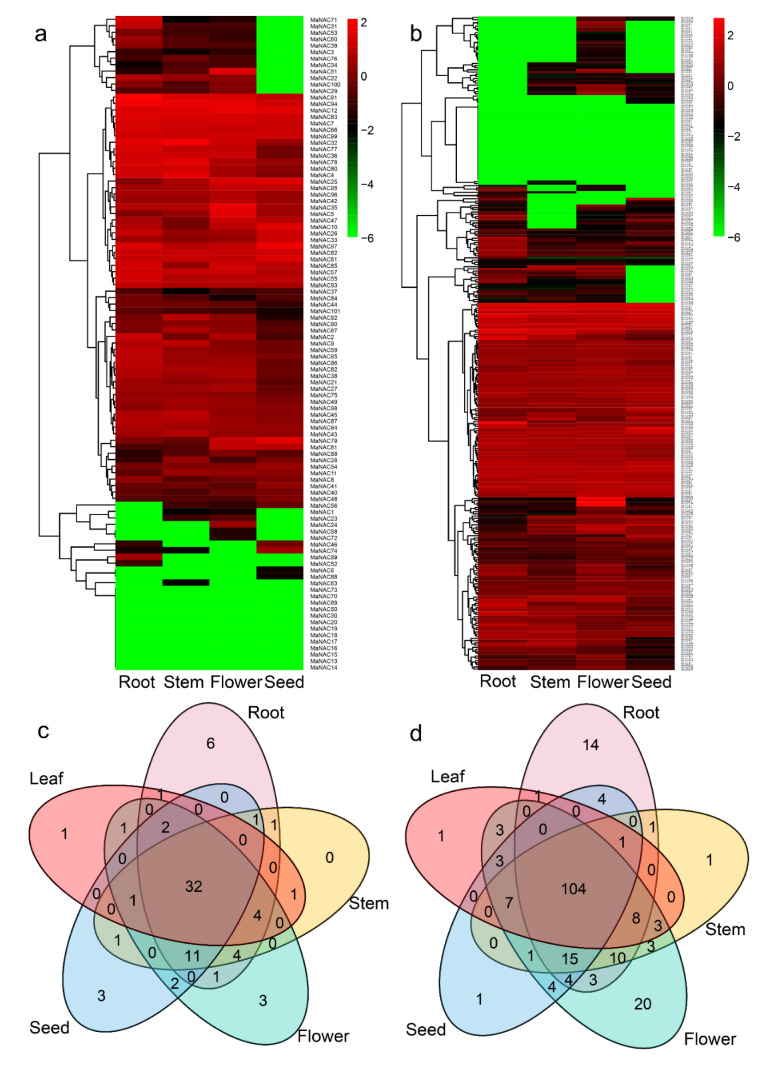
Figure 8.
Expression profiles of MaNACs and MaMYBs in the roots, stems, flowers and seeds. (a) Expression profiles of MaNACs in the roots, stems, flowers and seeds. (b) Expression profiles of MaMYBs in the roots, stems, flowers and seeds. (c) The overlap of expressed MaNAC genes (FPKM > 0.5) in different tissues. (d) The overlap of expressed MaMYB genes (FPKM > 0.5) in different tissues.

