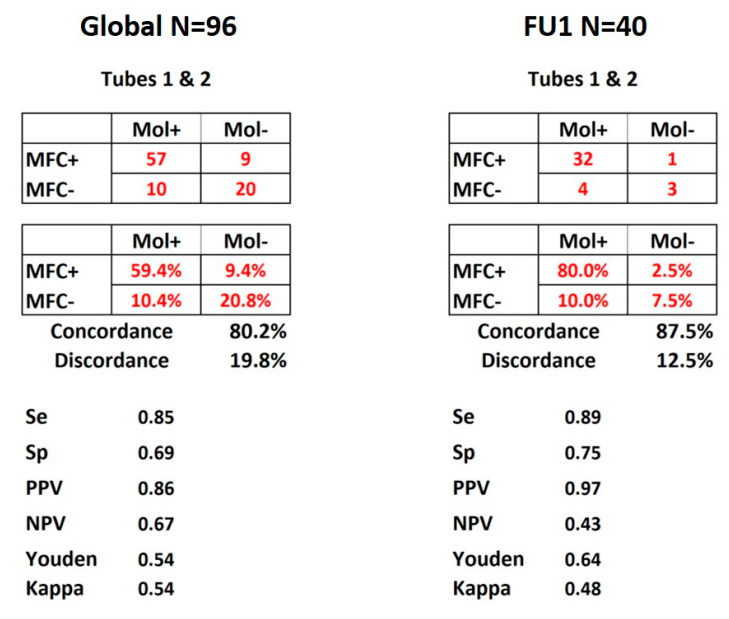
Figure 2.
MRD concordance matrices. Display of the results for all 96 FU time points and FU1 of the 40 patients. Both panels show the matrices of numbers and percentages of concordance between molecular and MFC MRD detection according to the combination of tubes 1 and 2. Se: sensitivity, Sp: specificity, PPV: positive predictive value, NPV: negative predictive value. Youden and kappa tests were used and values displayed as well.

