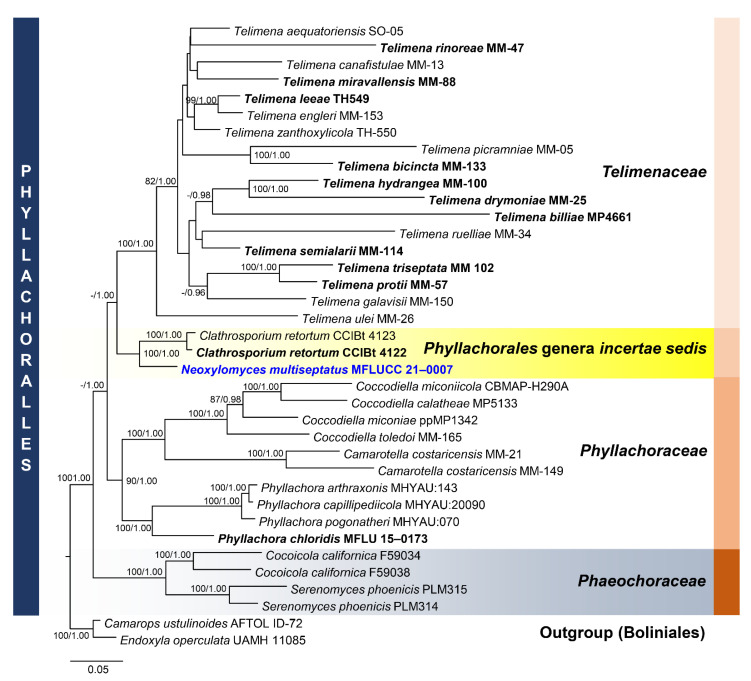
Figure 8.
Phylogram generated from maximum likelihood analysis based on combined LSU, SSU, ITS, and TEF1-α sequence data representing the species of Phyllachorales and related taxa. Sequences are taken from Dayarathne et al. [72] and Yang et al. [73]. Thirty-seven taxa were included in the combined analyses, which comprised 3259 characters (LSU = 863, SSU = 1175, ITS = 462, TEF1-α = 759) after alignment. The best scoring RAxML tree with a final likelihood value of −32,589.920351 is presented. The matrix had 2136 distinct alignment patterns, with 34.35% of undetermined characters or gaps. Estimated base frequencies were as follows: A = 0.248688, C = 0.249512, G = 0.274933, T = 0.226867; substitution rates: AC = 1.044099, AG = 1.599779, AT = 1.069911, CG = 1.048973, CT = 3.108380, GT = 1.000000; gamma distribution shape parameter α = 0.745075. Bootstrap support values for ML equal to or greater than 75% and BYPP equal to or greater than 0.95 are given above the nodes. Camarops ustulinoides (AFTOL-ID 72) and Endoxyla operculata (UAMH 11085) were used as the outgroup taxa. The newly generated sequence is indicated in blue. The ex-type strains are indicated in bold.

