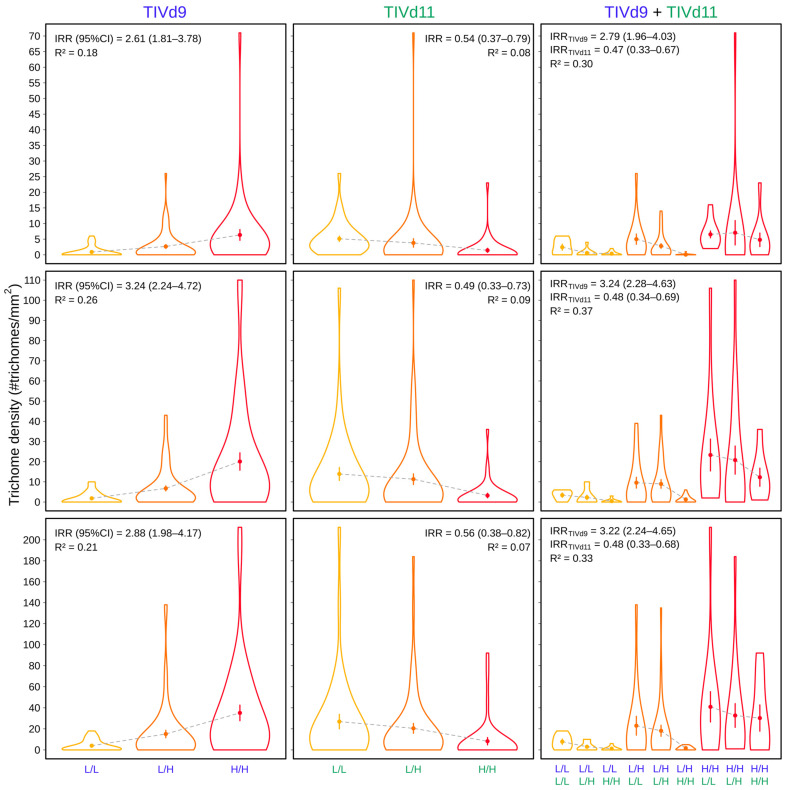
Figure 4.
Effect of QTLs TIVd9, TIVd11 and the additive model on trichome density along the three phenotyped weeks (6th, 7th, 8th weeks after transplanting. Incidence rate ratio (IRR) and 95% confidence intervals (values between brackets) and Nagelkerke R2 of the negative binomial logistic regression are shown for each combination. Violin plots for the two homozygotes (L/L and H/H) and the heterozygote (L/H) are represented. L refers to an allele of the low trichome density parental (LA2278) and H to an allele of the high trichome density parental (BGV016047). Mean trichome density and standard error for each genotype is shown inside each violin plot.

