Figure 1.
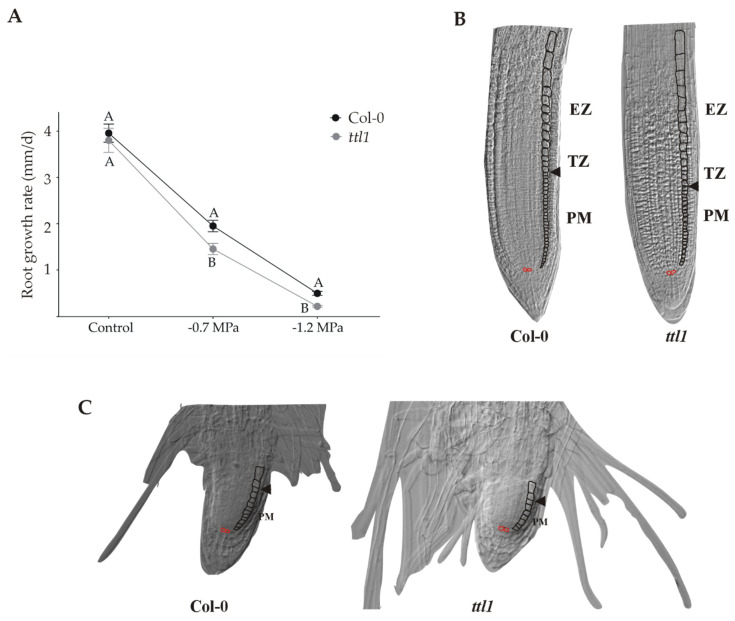
The ttl1 mutant exhibits greater reduction of root growth rate than Col-0 in response to increasing osmotic potential. (A) The graphic shows the root growth rate for Col-0 and ttl1 grown during 10 and 7 days in control and stressing −0.7 MPa and −1.2Mpa conditions, respectively. The magnitude of deceleration is higher in ttl1. Different letters indicate statistically significant differences (t Student p < 0.001; n = 30). (B) Images of the root apical meristem of Col-0 and ttl1 mutant grown in control conditions. (C) Images of the root apical meristem of Col-0 and ttl1 mutant after 7 days of growth in severe osmotic stress conditions (−1.2 MPa osmotic potential), showing the reduction in the number of cells in the proximal meristem (PM) and the reduction of the elongation zone (EZ) size.

