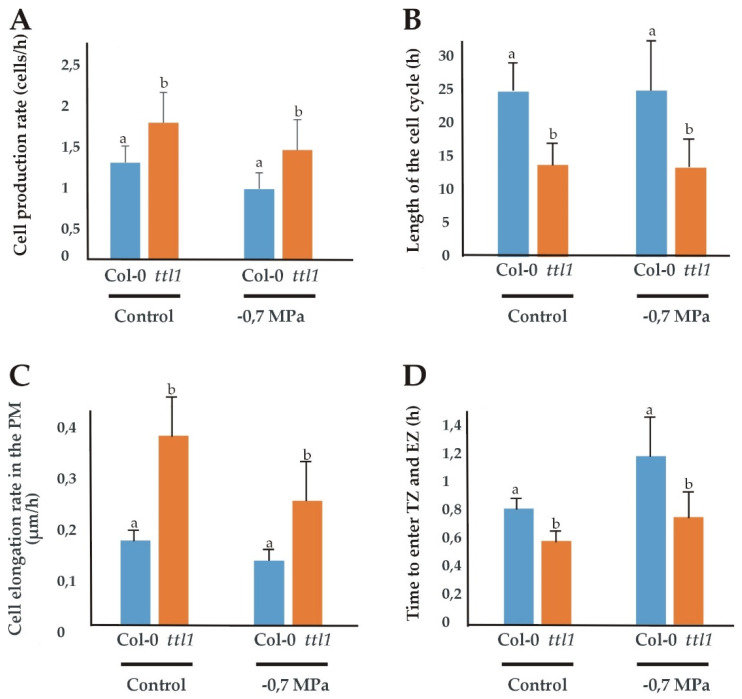
Figure 3.
Growth parameters in the PM of Col-0 and ttl1 roots grown in control and osmotic stress conditions. The figure shows the cell production rate (cells/h) (A); the length of the cell cycle (h) (B); the cell elongation rate (µm/h) (C) and the time to enter the transition zone (TZ) and elongation zone (EZ) (D) for Col-0 and ttl1 grown during 7 days in control and −0.7 MPa osmotic stress conditions. Values are means ± standard deviation (SD). Different letters indicate statistically significant differences (t Student p < 0.05; n = 10).

