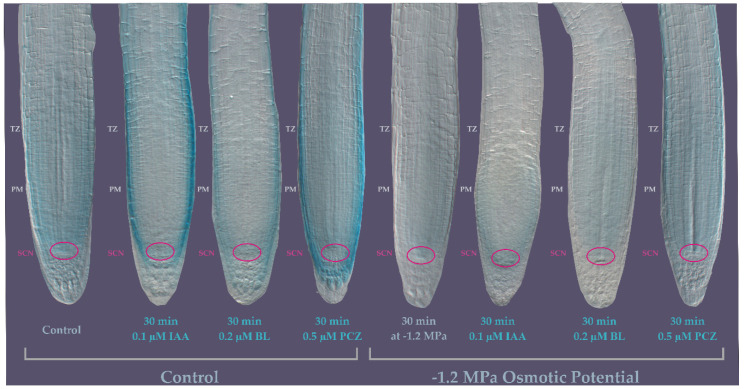
Figure 6.
Expression patterns of TTL1 Arabidopsis primary root using promoter::GUS analysis in response to osmotic potential and hormones. pTTL1::GUS roots grown in control conditions showing GUS signal localized to the stem cell niche (SCN) and the proximal meristem (PM) epidermis, cortex, endodermis and stele. pTTL1::GUS roots exposed during 30 min to control medium supplemented with 0.1 µM IAA showing GUS signal localized in the epidermis. pTTL1::GUS roots exposed during 30 min to control medium supplemented with 0.2 µM BL showing GUS signal in lateral root cap and epidermal cells. pTTL1::GUS roots exposed during 30 min to control medium supplemented with 0.5 µM PCZ showing GUS signal in columella, lateral root cap and epidermal cells. pTTL1::GUS roots grown in −1.2 MPa osmotic potential medium showing almost no GUS signal in the SCN and PM. pTTL1::GUS roots exposed during 30′ to −1.2 MPa osmotic potential medium supplemented with 0.1 µM IAA showing a pale signal in epidermal and cortex cells in the PM. pTTL1::GUS roots exposed during 30 min to −1.2 MPa osmotic potential medium supplemented with 0.2 µM BL showing a pale GUS signal in the PM. pTTL1::GUS roots exposed during 30 min to −1.2 MPa osmotic potential medium supplemented with 0.5 µM PCZ showing a pale GUS signal distributed similar to the one observed in control conditions without hormones supplemented. n = 15.

