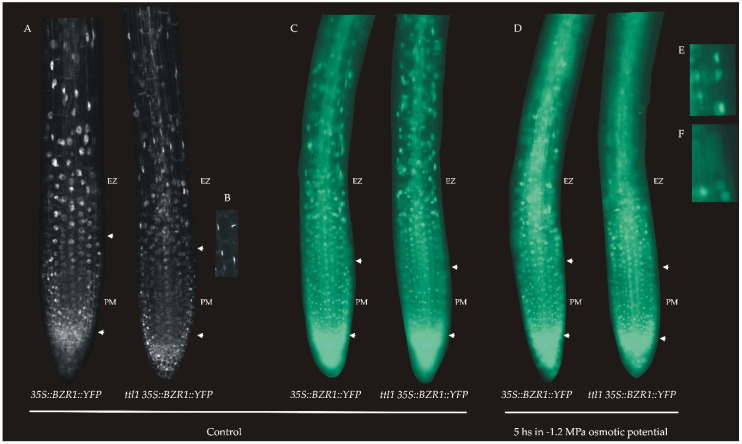
Figure 8.
(A) Expression pattern of BZR1 in roots of Col-0 and ttl1 mutant grown during 7 days in control conditions. (B) Zoomed in view of TZ showing the nuclear expression pattern in ttl1. This pattern suggests that cellular expansion begins earlier than in Col-0. Images were taken with Confocal Microscopy Zeiss LSM800—AiryScan n = 10. (C–F). Expression pattern of brassinosteroids (BR) in response to 5 h of severe osmotic stress. (C) 35S::BZR1::YFP in Col-0 and ttl1 mutant plants grown in control medium showing the YFP signal in the nuclei of EZ epidermal cells. (D) 35S::BZR1::YFP in Col-0 and ttl1 mutant plants grown during 5 h of severe osmotic stress showing YFP signal localized in the cytoplasm of epidermal EZ cells. (E) Zoomed in view of signal in epidermal EZ cells of ttl1 mutant grown in control condition showing the nuclei localization of YFP signal. (F) Zoomed in view of signal in epidermal EZ cells of ttl1 mutant grown in hyperosmotic condition showing the cytoplasmic localization of YFP signal. Images were taken with Epifluorescence microscope ZEIZZ—AXIO Imager. M2.

