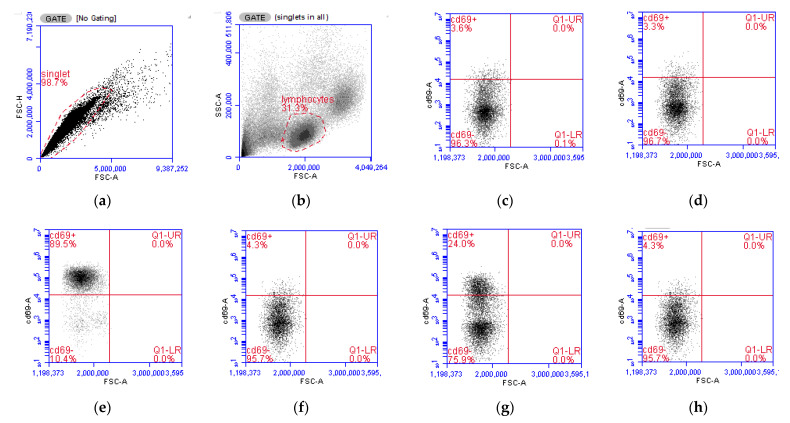
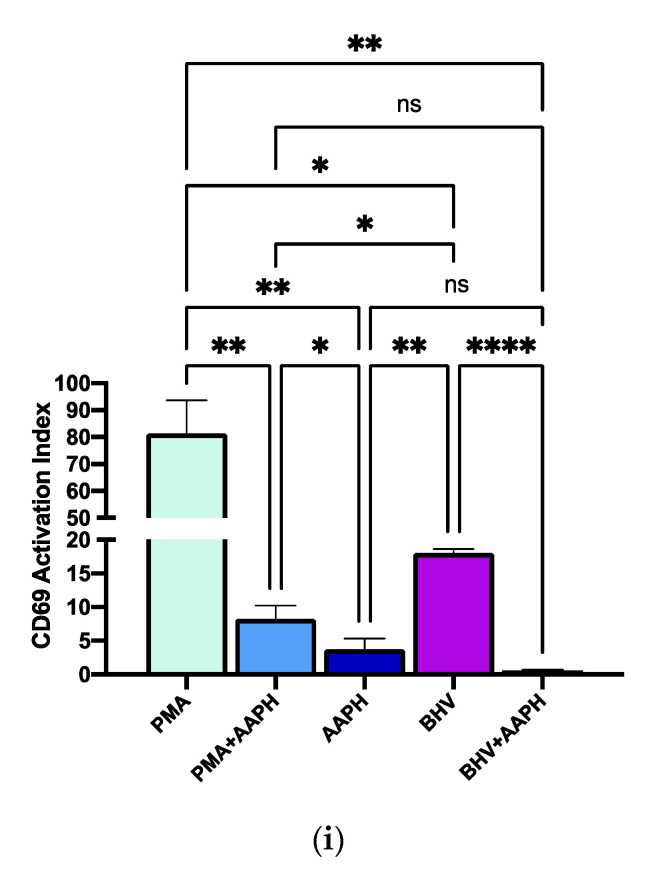
Figure 6.
Flow cytometry analysis of lymphocyte populations from isolated peripheral mononuclear blood cells (PBMCs). (a). Gating strategy for singlets. (b) Gating strategy for lymphocytes based on forward scatter (FSC-A) and side scatter (SSC-A) characteristics. (c) CD69+ expression in untreated PBMCs, on the X axis FSC-A indicating cell size and on the Y axis the evaluated CD69 dye. (d) CD69 expression under 2,2′-Azobis(2-amidinopropane) dihydrochloride (AAPH) treatment. (e) CD69 expression under 10 ng/mL phorbol 12-myristate 13-acetate (PMA) treatment. (f) CD69 expression under PMA + AAPH. (g) CD69 expression under Bovine Herpesvirus 1 (BHV-1) stimulation. (h) CD69 expression under BHV-1 + AAPH. (i) Lymphocytes’ activation Index according to the CD69 expression index (Equation (2)). PMA = PBMCs treated with 10 ng/mL PMA and 1 g/mL ionomycin; PMA + AAPH = PBMCs treated with 10 ng/mL PMA, 1 g/mL ionomycin, and 3 mM AAPH; AAPH = PBMCs treated with 3 mM AAPH; BHV = PBMCs treated 8 × 10⁴ TCID50 BHV-1 per 1 × 10⁶ PBMCs; BHV-1 + AAPH = PBMCs treated 8 × 10⁴ TCID50 BHV-1 per 1 × 10⁶ PBMCs and 3 mM AAPH. Results are expressed as estimated means ± SEM and were compared with Tukey’s test. * p < 0.05, ** p < 0.01, **** p < 0.0001, ns: p > 0.05.


