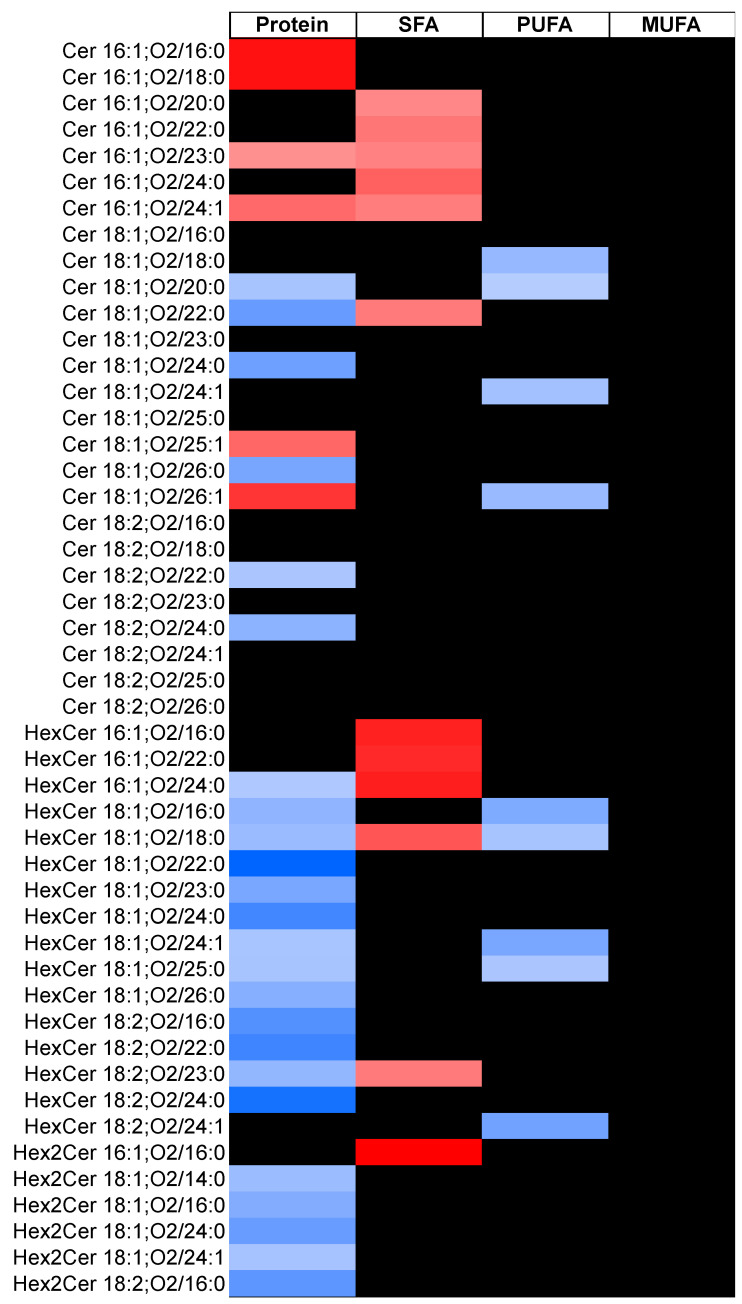
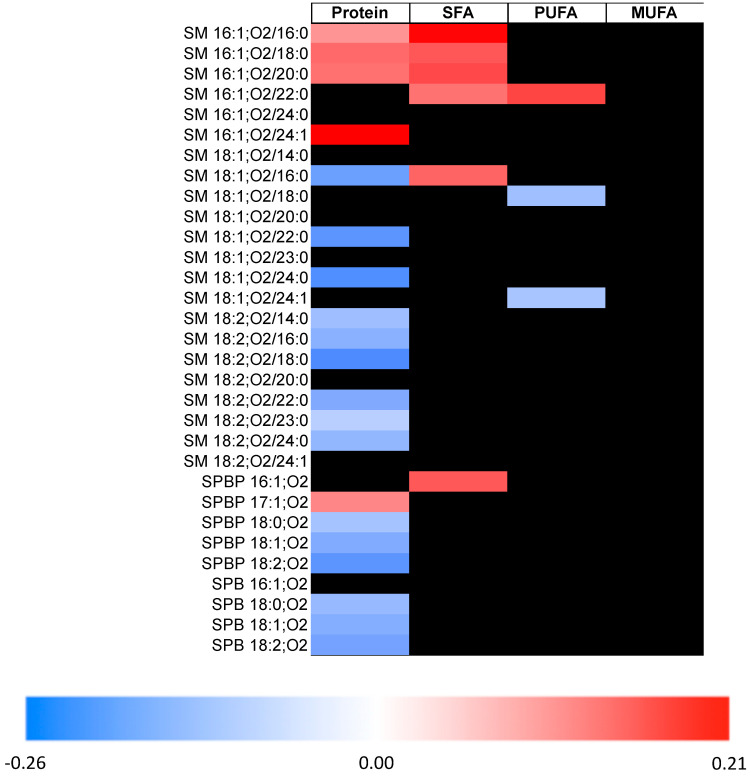
Figure 1.
Associations between intakes of protein and different types of fat, and individual sphingolipid concentrations of the SP2 participants (n = 2860). Associations that are not statistically significant (adjusted p > 0.050) after Benjamini‑Hochberg correction are indicated with a black box. We quantified 26 ceramides (Cers), 16 monohexosylceramides (HexCers), 6 dihexosylceramides (Hex2Cers), 22 sphingomyelins (SMs), 5 sphingoid base phosphates (SPBPs), and 4 sphingoid bases (SPBs) for a total of 79 sphingolipid species. The colors are beta coefficients from linear regression analysis representing the change per SD in circulating sphingolipids (log-transformed values) for every 5% of total energy intake increment in nutrient intake. We adjusted for age, sex, energy intake, BMI, alcohol intake, physical activity, cigarette smoking, high-density lipoprotein cholesterol, low-density lipoprotein cholesterol, and triglycerides. We adjusted for age, sex, energy intake, BMI, alcohol intake, physical activity, cigarette smoking, high-density lipoprotein cholesterol, low-density lipoprotein cholesterol, and triglycerides. Additionally, for protein and total fat outcomes, we mutually adjusted them for each other, and for saturated fat, polyunsaturated fat, and monounsaturated fat outcomes, these were mutually adjusted for each other in addition to protein intake. Abbreviations: MUFA, monounsaturated fatty acid, PUFA, polyunsaturated fatty acid, SFA, saturated fatty acid.


