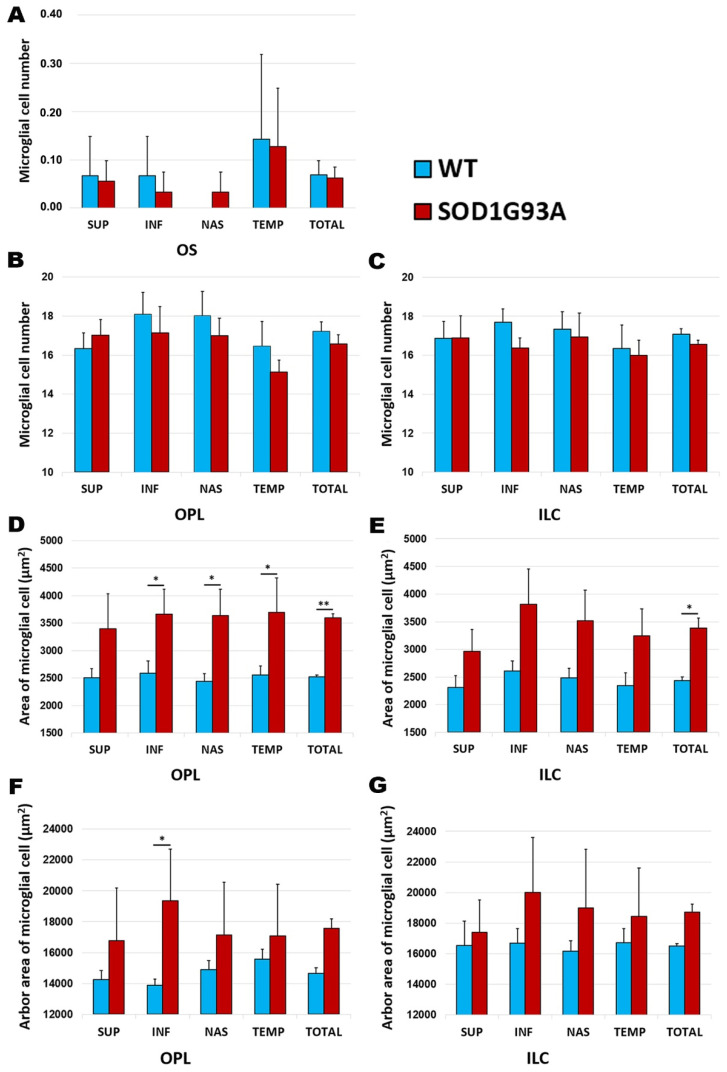
Figure 5.
Morphometric analysis of the signs of microglial activation in the wild type group and the SOD1G93A group. (A–C) The number of Iba-1+ cells per area of 0.1502 mm2 in the OS (A), OPL (B), and ILC (C); (D,E) Quantitative analysis of the area of the microglial cells (µm2) in OPL (D) and ILC (E). (F–G) Quantitative analysis of the arbor area of the microglial cells (µm2) in OPL (F) and ILC (G). The histograms show the mean number (± standard deviation, SD). * p < 0.05, ** p < 0.01. Photoreceptor outer segment layer (OS), outer plexiform layer (OPL), and inner layer complex (ILC) (constituted by an inner plexiform layer and a nerve fiber–ganglion cell layer). Wild type (WT). Superior (SUP), inferior (INF), nasal (NAS), and temporal (TEM). Number of retinas used in the experiment, WT: n = 6; and SOD1G93A: n = 6. Statistical test: Mann–Whitney U test.

