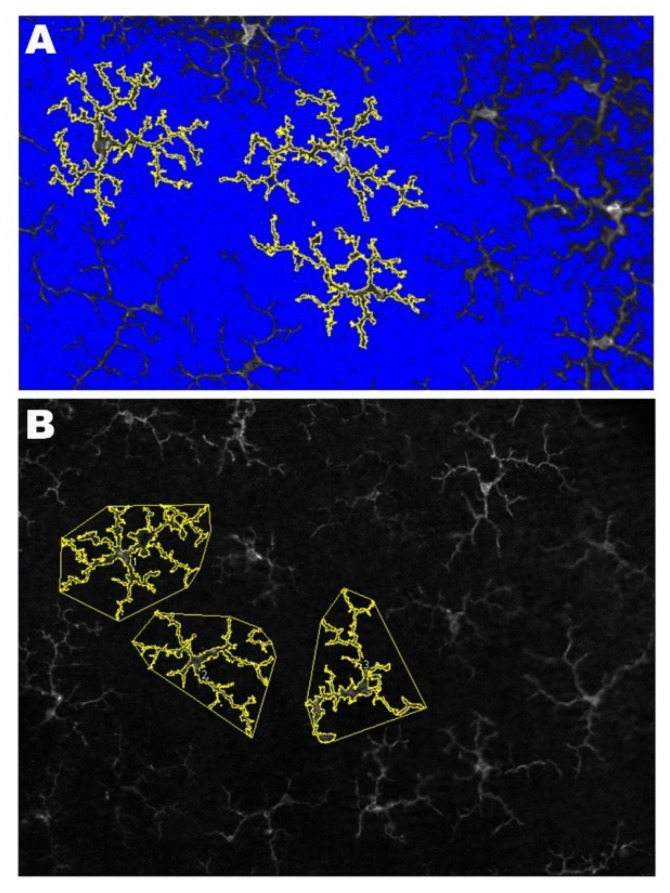
Figure 8.
Methodology for the quantification of the microglial cells. (A) The photomicrograph shows the results of processing with the Image J program to analyze of the area occupied by each microglial cell. (B) The photomicrograph illustrates the method used for the quantification of the arbor area using the Image J program. By using the polygon tool, the most distal tips of the microglial processes were connected.

