Figure 4.
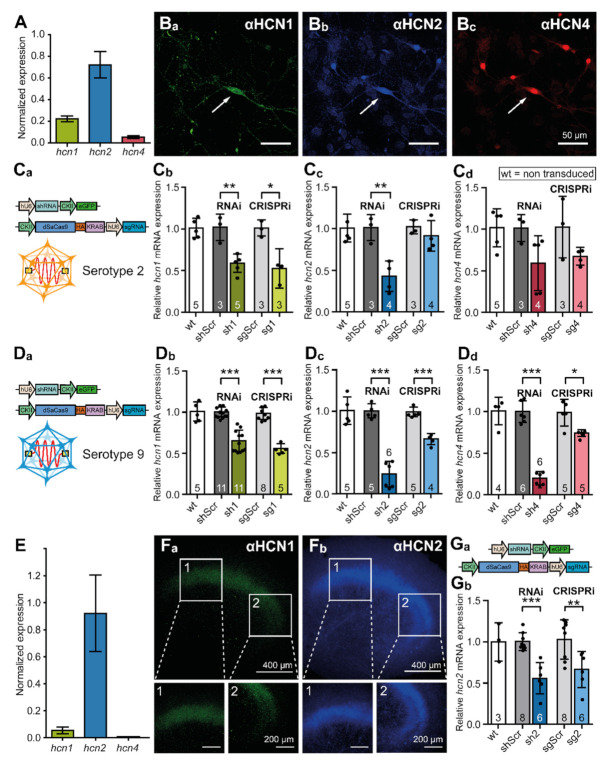
RNAi and CRISPRi reduce the amount of HCN channel transcripts in PHNs and OHSCs. (A) qRT-PCR analysis of transcript expression levels for HCN isoforms 1, 2, and 4 in primary hippocampal neurons (PHNs). Transcript expression levels were normalized to gapdh. Values shown are calculated to 1 as the sum of all hcn transcripts. cDNA was prepared from 5 coverslips with PHNs from at least three different animals. (Ba–Bc) Representative immunofluorescence images showing expression of HCN-channel isoforms 1 (green), 2 (blue) and 4 (red). Isoforms were stained using specific antibodies combined with fluorescently labeled secondary antibodies. (Ca) Schematic representation of constructs delivered by rAAV2 to PHNs. (Cb–Cd) qRT-PCR analysis of hcn1, hcn2, and hcn4 mRNA levels in hippocampal neurons after transduction with shRNA or sgRNA/dSaCas9 expressing rAAVs. (Da) Schematic representation of constructs delivered by rAAV9 to PHNs. (Db–Dd) qRT-PCR analysis of hcn1, hcn2, and hcn4 mRNA levels in hippocampal neurons after transduction with shRNA or sgRNA/dSaCas9 expressing rAAVs. (E) qRT-PCR analysis of transcript expression levels for HCN isoforms 1, 2, and 4 in organotypic hippocampal slice cultures (OHSCs). The transcript expression levels were normalized to gapdh. Values shown are calculated to 1 as the sum of all hcn transcripts. cDNA was prepared from five culture inserts, each containing three individual slices. In total, slices were obtained from three different animals. (Fa,Fb) Representative immunofluorescence images showing the expression of HCN-channel isoforms 1 (green) and 2 (blue). The isoforms were stained using specific antibodies. Enlargements show HCN-isoform expression in hippocampal CA1 (1) and CA3 (2) subfields. (Ga,Gb) qRT-PCR knock-down analysis of hcn2 mRNA levels in organotypic slices after transduction with shRNA or sgRNA/dSaCas9 expressing rAAV9. The data were obtained from indicated numbers of culture inserts, each containing three individual slices. In total, slices were obtained from at least three different animals. The results are depicted as mean ± standard deviation. Statistical significance was assessed using the unpaired two-tailed Student’s t test, * p < 0.05, ** p < 0.01, *** p < 0.001.

