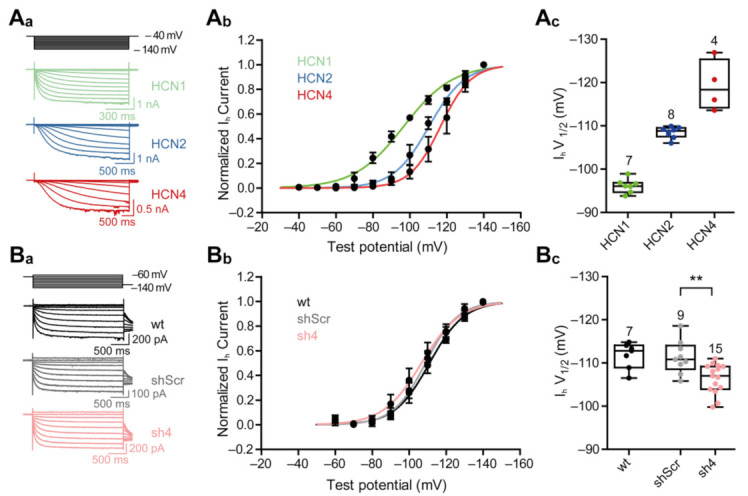
Figure 5.

Knock-down of HCN-channel subunit four shifts half-maximal activation voltage of Ih. (Aa) Representative current traces of whole-cell patch-clamp recordings from −40 to −140 mV (Δ−10 mV) of HEK293 cells constitutively expressing HCN-channel subunit 1, 2, or 4. (Ab) Activation curves of HCN-channel subunits 1, 2 and 4 measured from steady-state currents. The continuous lines represent fits to the Boltzmann function of the data. (Ac) Half-maximal activation voltages of the different HCN-channel subunits, converted from the Boltzmann functions of whole-cell currents. (Ba) Representative current traces of whole-cell patch-clamp recordings from −60 to −140 mV (Δ−10 mV) of wildtype (wt, non-transduced) primary hippocampal neurons (PHNs) or rAAV9-transduced eGFP-positive PHNs, either expressing sh4 or shScr. (Bb) Activation curves of wt and transduced PHNs. The continuous lines represent fits to the Boltzmann functions of the data. (Bc) Half-maximal activation voltages wt and sh4- or shScr-transduced PHNs, derived from the Boltzmann functions of whole-cell currents. The results are depicted as boxplots. Statistical significance was assessed using the unpaired two-tailed Student’s t test, ** p < 0.01.
