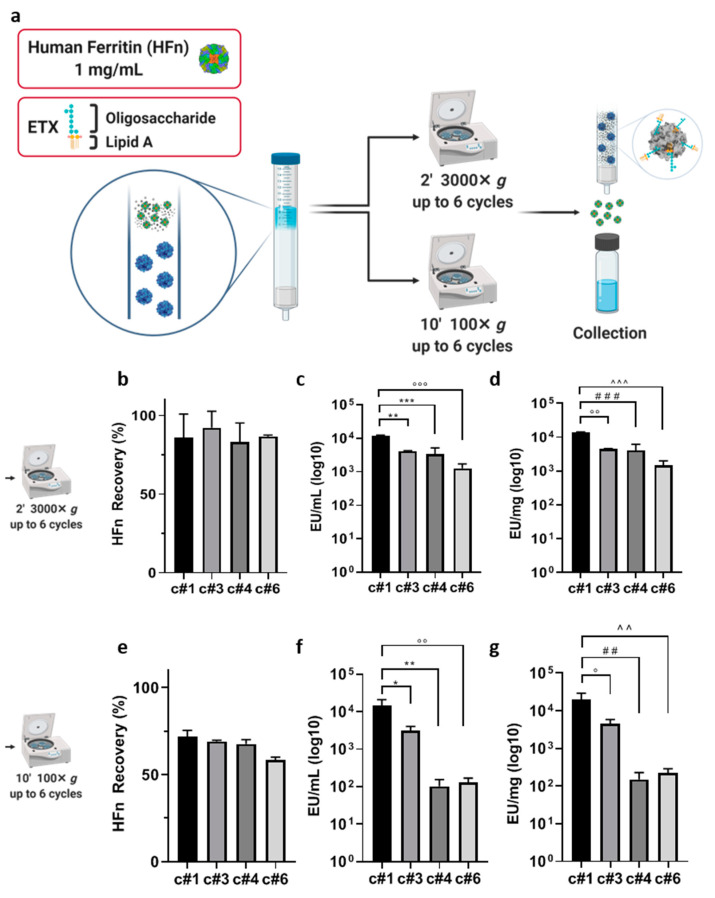
Figure 1.
Purification strategy using Endotrap HD columns. The column was loaded with HFn (1 mg/mL) and centrifuged for up to six cycles at the speed of 3000× g for 2′ (a) or 100× g (e) for 10′. The eluted protein suspension was reloaded in the upper part of the column after every cycle. H-ferritin nanocage (HFn) recovery was calculated by absorbance reading (b,e) and endotoxin (ETX) levels have been obtained by LAL test (c,d,f,g). Results from cycles 1, 3, 4 and 6 have been inserted in graphs and labelled as c#1, c#3, c#4 and c#6, respectively. Results are reported as average ± S. D. of 6 independent experiments. Statistical significance panels c and d: ** p = 0.0013, *** p = 0.0005, °°° p = 0.0001, °° p = 0.0013, ### p = 0.006, ^^^ p = 0.0002. Statistical significance panels f and g: * p = 0.0122, ** p = 0.0029, °° p = 0.0030, ° p = 0.0130, ## p = 0.0029, ^^. p = 0.0030.

