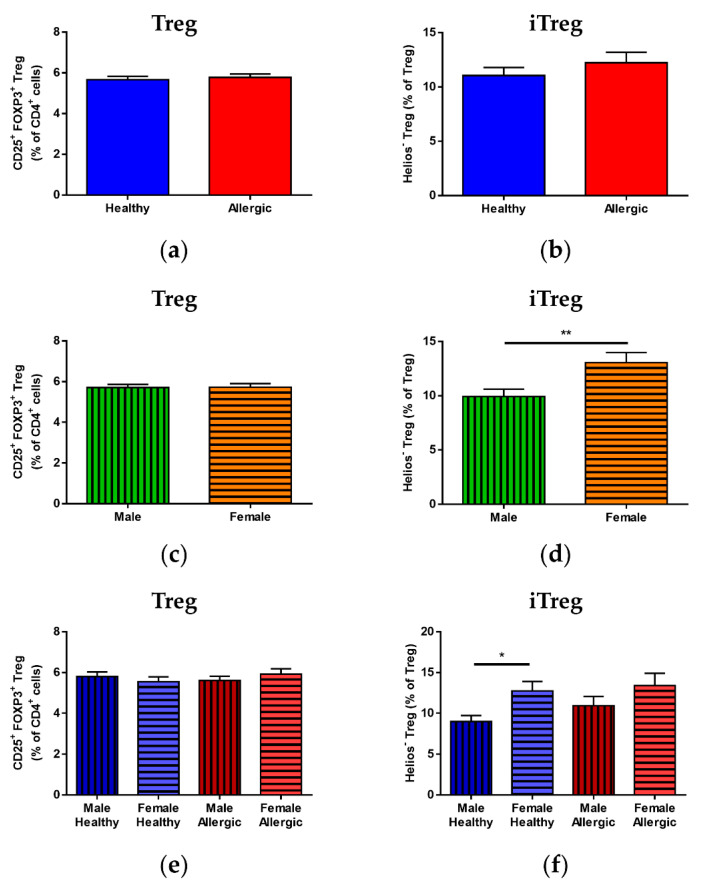
Figure 1.
Proportions of total regulatory T cells (Treg) population and induced Treg (iTreg) and natural Treg (nTreg) subpopulations in cord blood of male and female children of healthy and allergic mothers. Samples of cord blood (n = 226) were stained and analyzed by flow cytometry. (a,b) Flow cytometry analysis of cord blood samples of children of healthy (n = 118) and allergic (n = 108) mothers. (a) Proportion of CD25+FOXP3+ Treg in the cord blood CD4+ T cell population. (b) Proportion of Helios− iTreg in the cord blood Treg population. (c,d) Flow cytometry analysis of cord blood samples of male (n = 104) and female (n = 122) newborns. (c) Proportion of CD25+FOXP3+ Treg in the cord blood CD4+ T cell population. (d) Proportion of Helios− iTreg in the cord blood Treg population. ** p = 0.0098. (e,f) Flow cytometry analysis of cord blood samples of newborns divided according to sex and maternal allergy status: male children of healthy mothers (n = 53), female children of healthy mothers (n = 65), male children of allergic mothers (n = 51) and female children of allergic mothers (n = 57). (e) Proportion of CD25+FOXP3+ Treg in the cord blood CD4+ T cell population. (f) Proportion of Helios− iTreg in the cord blood Treg population. * p = 0.0121.

