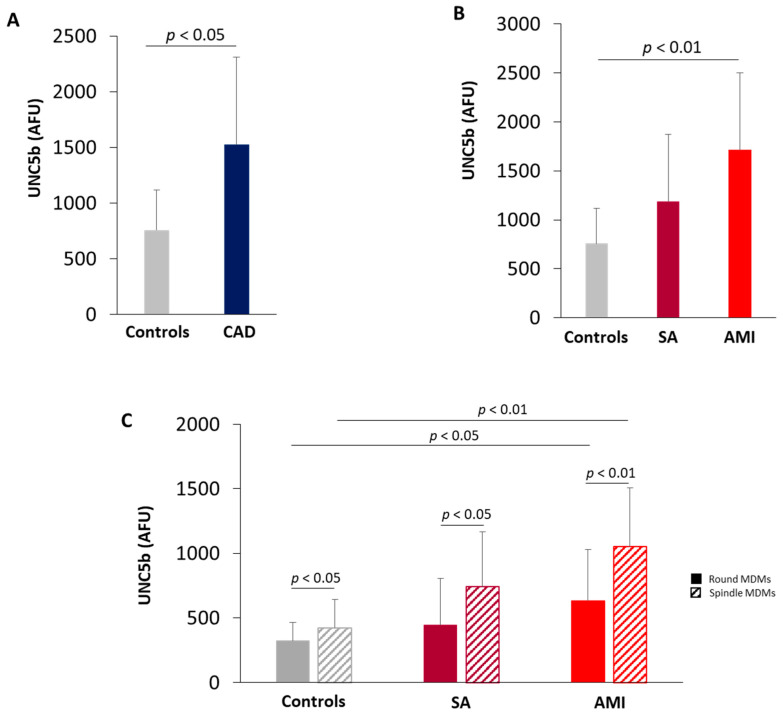
Figure 3.
Quantitative analysis of UNC5b receptor. UNC5b levels in MDMs obtained from (A) Control subjects and CAD patients (Controls = 9; CAD = 28); (B) control subjects, SA, and AMI patients (Controls = 9; SA = 10; AMI = 18); (C) UNC5b levels in round and spindle MDMs obtained from control, SA and AMI patients. Data are expressed as mean ± SD of AFU (fluorescence intensity/µm2). At least three fields, 400× magnification, were analyzed.

