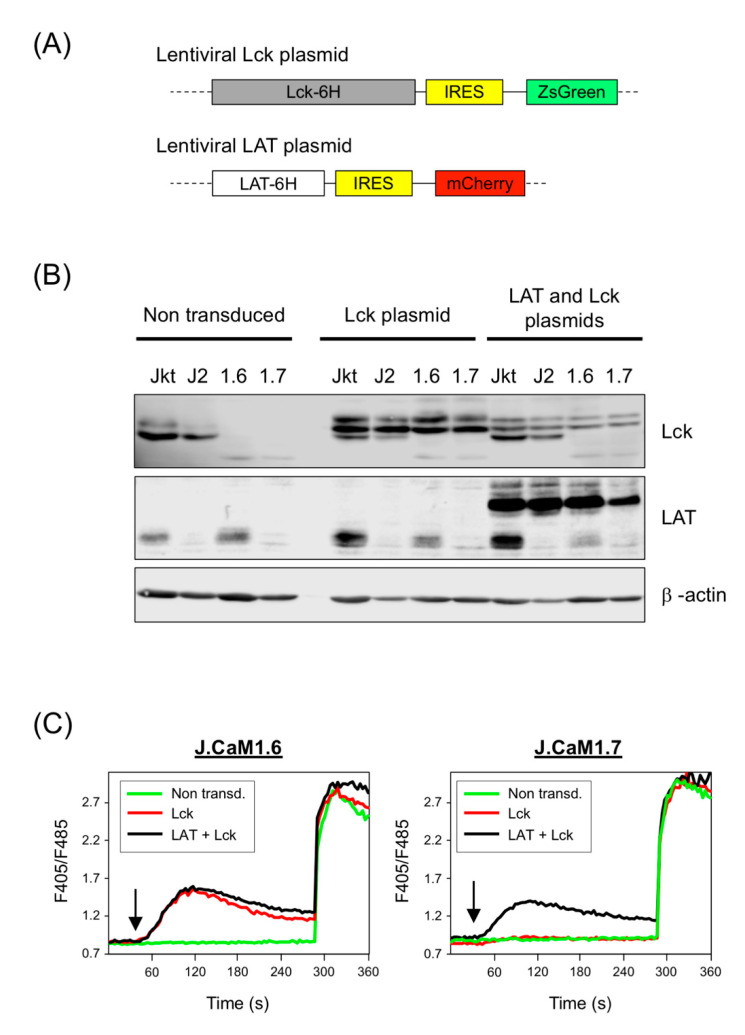
Figure 6.
Lentiviral transduction of LAT and Lck in J.CaM1.6 and J.CaM1.7 cells and calcium analysis. (A) Schematic representation of the coding regions included in the lentiviral plasmids generated for the expression of Lck and LAT. ZsGreen or mCherry reporters are located after an IRES sequence, placed downstream of Lck-6His or LAT-6His, respectively. (B) LAT and Lck expression was analyzed after lentiviral transduction of Jurkat (Jkt), J.CaM2 (J2), J.CaM1.6 (1.6), and J.CaM1.7 (1.7) cells with plasmids coding for Lck and LAT. Immunoblots were done with the indicated antibodies. Anti-β actin immunoblot in the lower panel was performed with the same cell lysates to show equal protein loading. (C) J.CaM1.6 cells (left panel) and J.CaM1.7 cells non-transduced (green line) or lentivirally transduced with plasmids coding for Lck (red line) or with the two plasmids coding for LAT and Lck t were loaded with Indo-1AM and stimulated with OKT3 mAb (1 μg/mL) at the indicated times (black arrows). The intracellular Ca2+ concentration was determined at 37 °C through the change in Indo-1AM fluorescence. The graphics represent the average of 9 experiments.

