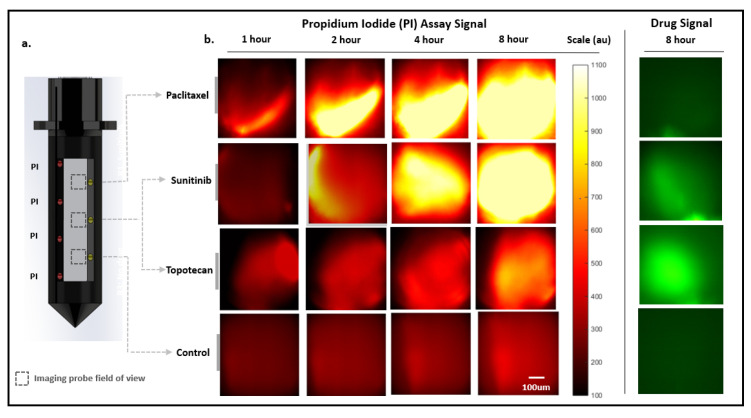
Figure 4.
Miniaturized 2-color microscopy (M-2CFM) over 8 h in a live murine MC38 tumor. (a). Microdevice drug and assay loading diagram. The three distinct drug release sites spaced 1.1 mm apart contain Paclitaxel (n = 5), Sunitinib (n = 3) or Topotecan (n = 2), and Control (inert polyethylene glycol, PEG) (n = 5). Propidium iodide (PI) assay is loaded and released from four reservoirs located on the opposite side of the microdevice optical window. PI diffuses equally into all drug-exposed tissue regions (dotted boxes), which can be individually imaged. (b). M-2CFM fluorescent imaging of each drug-exposed tissue region in red (assay) and green (drug) channels over 8 h.

