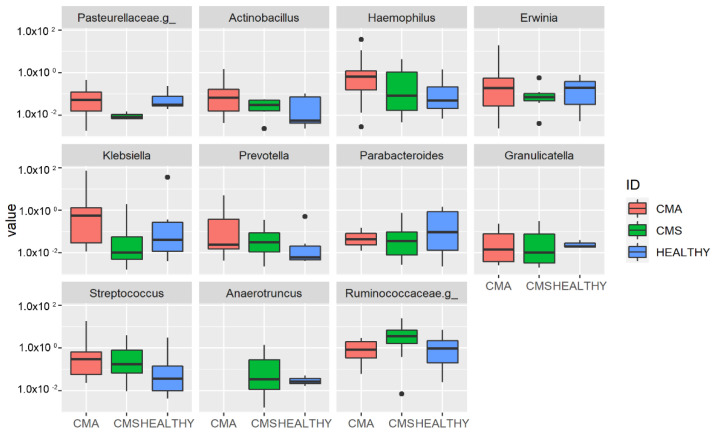
Figure 5.
Operational Taxonomic Unit (OUT) distribution of the gut microbiota for the three groups’ comparison assessed by DeSeq2 test at genus level. The interquartile range is represented by the box and the line in the box is the median. The whiskers indicate the largest and the lowest data points, respectively, while the dots symbolize outliers. Only statistically significant OTUs (p < 0.05) are plotted.

